| ♥ 0 |
Hi Pete. I came across a previous post in which you created a script to include the MACD histogram colors on the TOS watchlist. It’s been a huge help to me – thanks a ton. Are you able to assist me with also creating a scan that identifies symbols that are currently in the uptrending dark red of the MACD histo? Below I have provided 1) a link to the previous post 2) the script that I have written so far. Thank you! https://www.hahn-tech.com/ans/macd-watchlist-background-color/
Marked as spam
Asked on January 3, 2021 9:15 am
586 views
|
|
Private answer
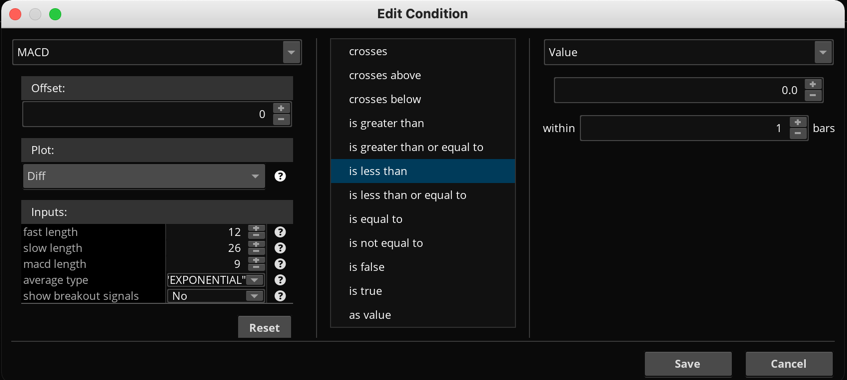
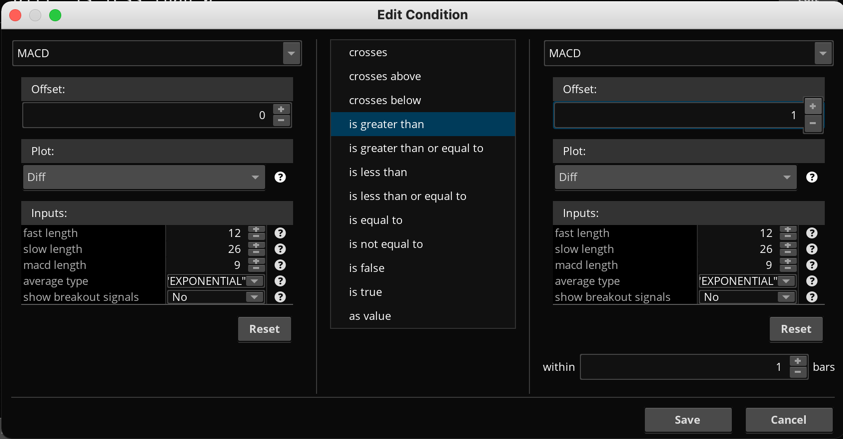
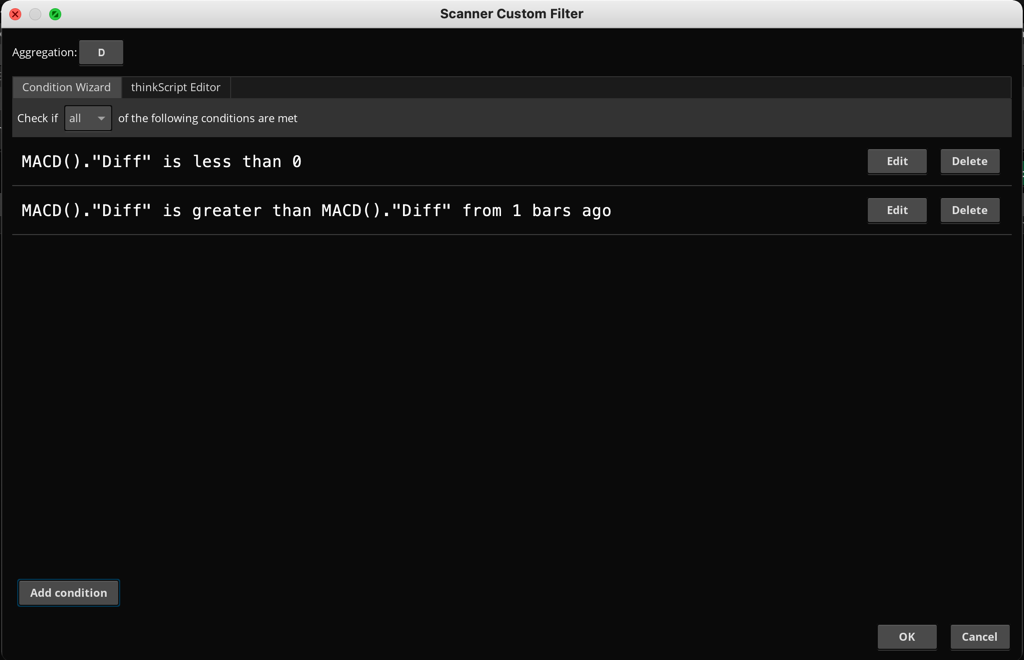
Let's get you out of the code mindset for this solution. You don't need to know anything about writing code to build this scan. Look at the MACD Histogram. The dark read bars have two attributes:
We build this using the condition Wizard in just a few simple clicks of the mouse. Screenshots below show the basic steps required to build these two elements into a Study Filter using the Condition Wizard. If you would like to learn how to use the Condition Wizard, check out the following free video tutorial: https://www.hahn-tech.com/thinkorswim-condition-wizard/
Attachments:
Marked as spam
Answered on January 3, 2021 9:49 am
|