MACD MTF Scan Modification


Category:
0
0

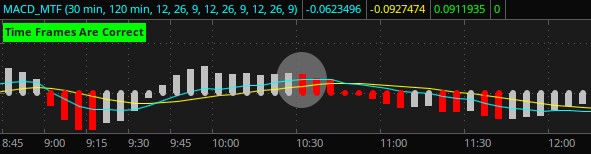
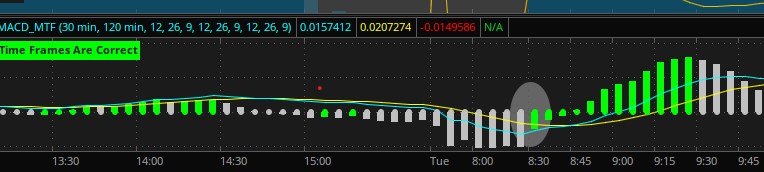
Hi Pete,

I am reviewing the MACD MTF you created in a previous post. The link to the post is:

Thinkorswim MTF MACD Scan

I am trying to slightly modify the scan to search for MACD MTF signals ONLY when the initial green histogram bar is below zero or an initial red histogram bar is above zero.  Please see the attached screen shots with examples of the signals I would like to scan for.

I added “Diff” is greater than 0″ to the Plot Scan line of the short term MACD search but it doesn’t seem to provide consistent results.

input fastLength = 12;
input slowLength = 26;
input MACDLength = 9;
input averageType = AverageType.EXPONENTIAL;
def Diff = MACD(fastLength, slowLength, MACDLength, averageType).Diff;
#plot scan = Diff[1] >= Diff[2] and MACDHistogram().”Diff” is greater than 0;
# OR
plot scan = Diff[1] <= Diff[2] and MACDHistogram().”Diff” is less than 0;


Attachments:
Marked as spam
Posted by (Questions: 19, Answers: 18)
Asked on September 9, 2020 7:24 pm
124 views
0
Private answer

Great question, very thoughtful idea. Two things to cover here.

  1. The use of MACDHistogram().”Diff” completely disconnects that section of the code from every other part of the code. That snippet, grabs the value of the current histogram bar of the standard MACDHistogram study, using only the default values provided by that study. If you change of the user inputs in the first several lines of this code it will not at all match the section of code you added. Very confusing when you start to test things out and try to discover why nothing works as expected. But that is not what is causing the problem at all. It's just very poor form.
  2. So that is first step in solving this. Which is that you need to be using the variable that is already declared in the fifth line of the code: "Diff". This will ensure that if you change the user inputs everything will match. So to clear, the first step to correct this is to replace MACDHistogram().”Diff” with the one that is already declared:  "Diff". Then you need to match the index value that is applied in the first "Diff" listed in the plot scan statement. That index value is [1]. So what you need to have in place of MACDHistogram().”Diff” is Diff[1];

Final thoughts. What you did was to create a filter condition for the current bar of the MACD Histogram to be less than or greater than zero. But the signal itself is being generated from the previous bar of the MACD Histogram: Diff[1].

That should clear things up. There are some chart settings that can cause your intraday charts to be misaligned with your scan results. But that topic has been covered numerous times in this forum. If you have no clue what I just said, be sure to take the time to view the most recent video we published for scans:

https://www.hahn-tech.com/thinkorswim-scans-beginner-to-advanced/


Marked as spam
Posted by (Questions: 37, Answers: 4087)
Answered on September 9, 2020 8:59 pm