Make scan from SMI lower study


Category:
0
0

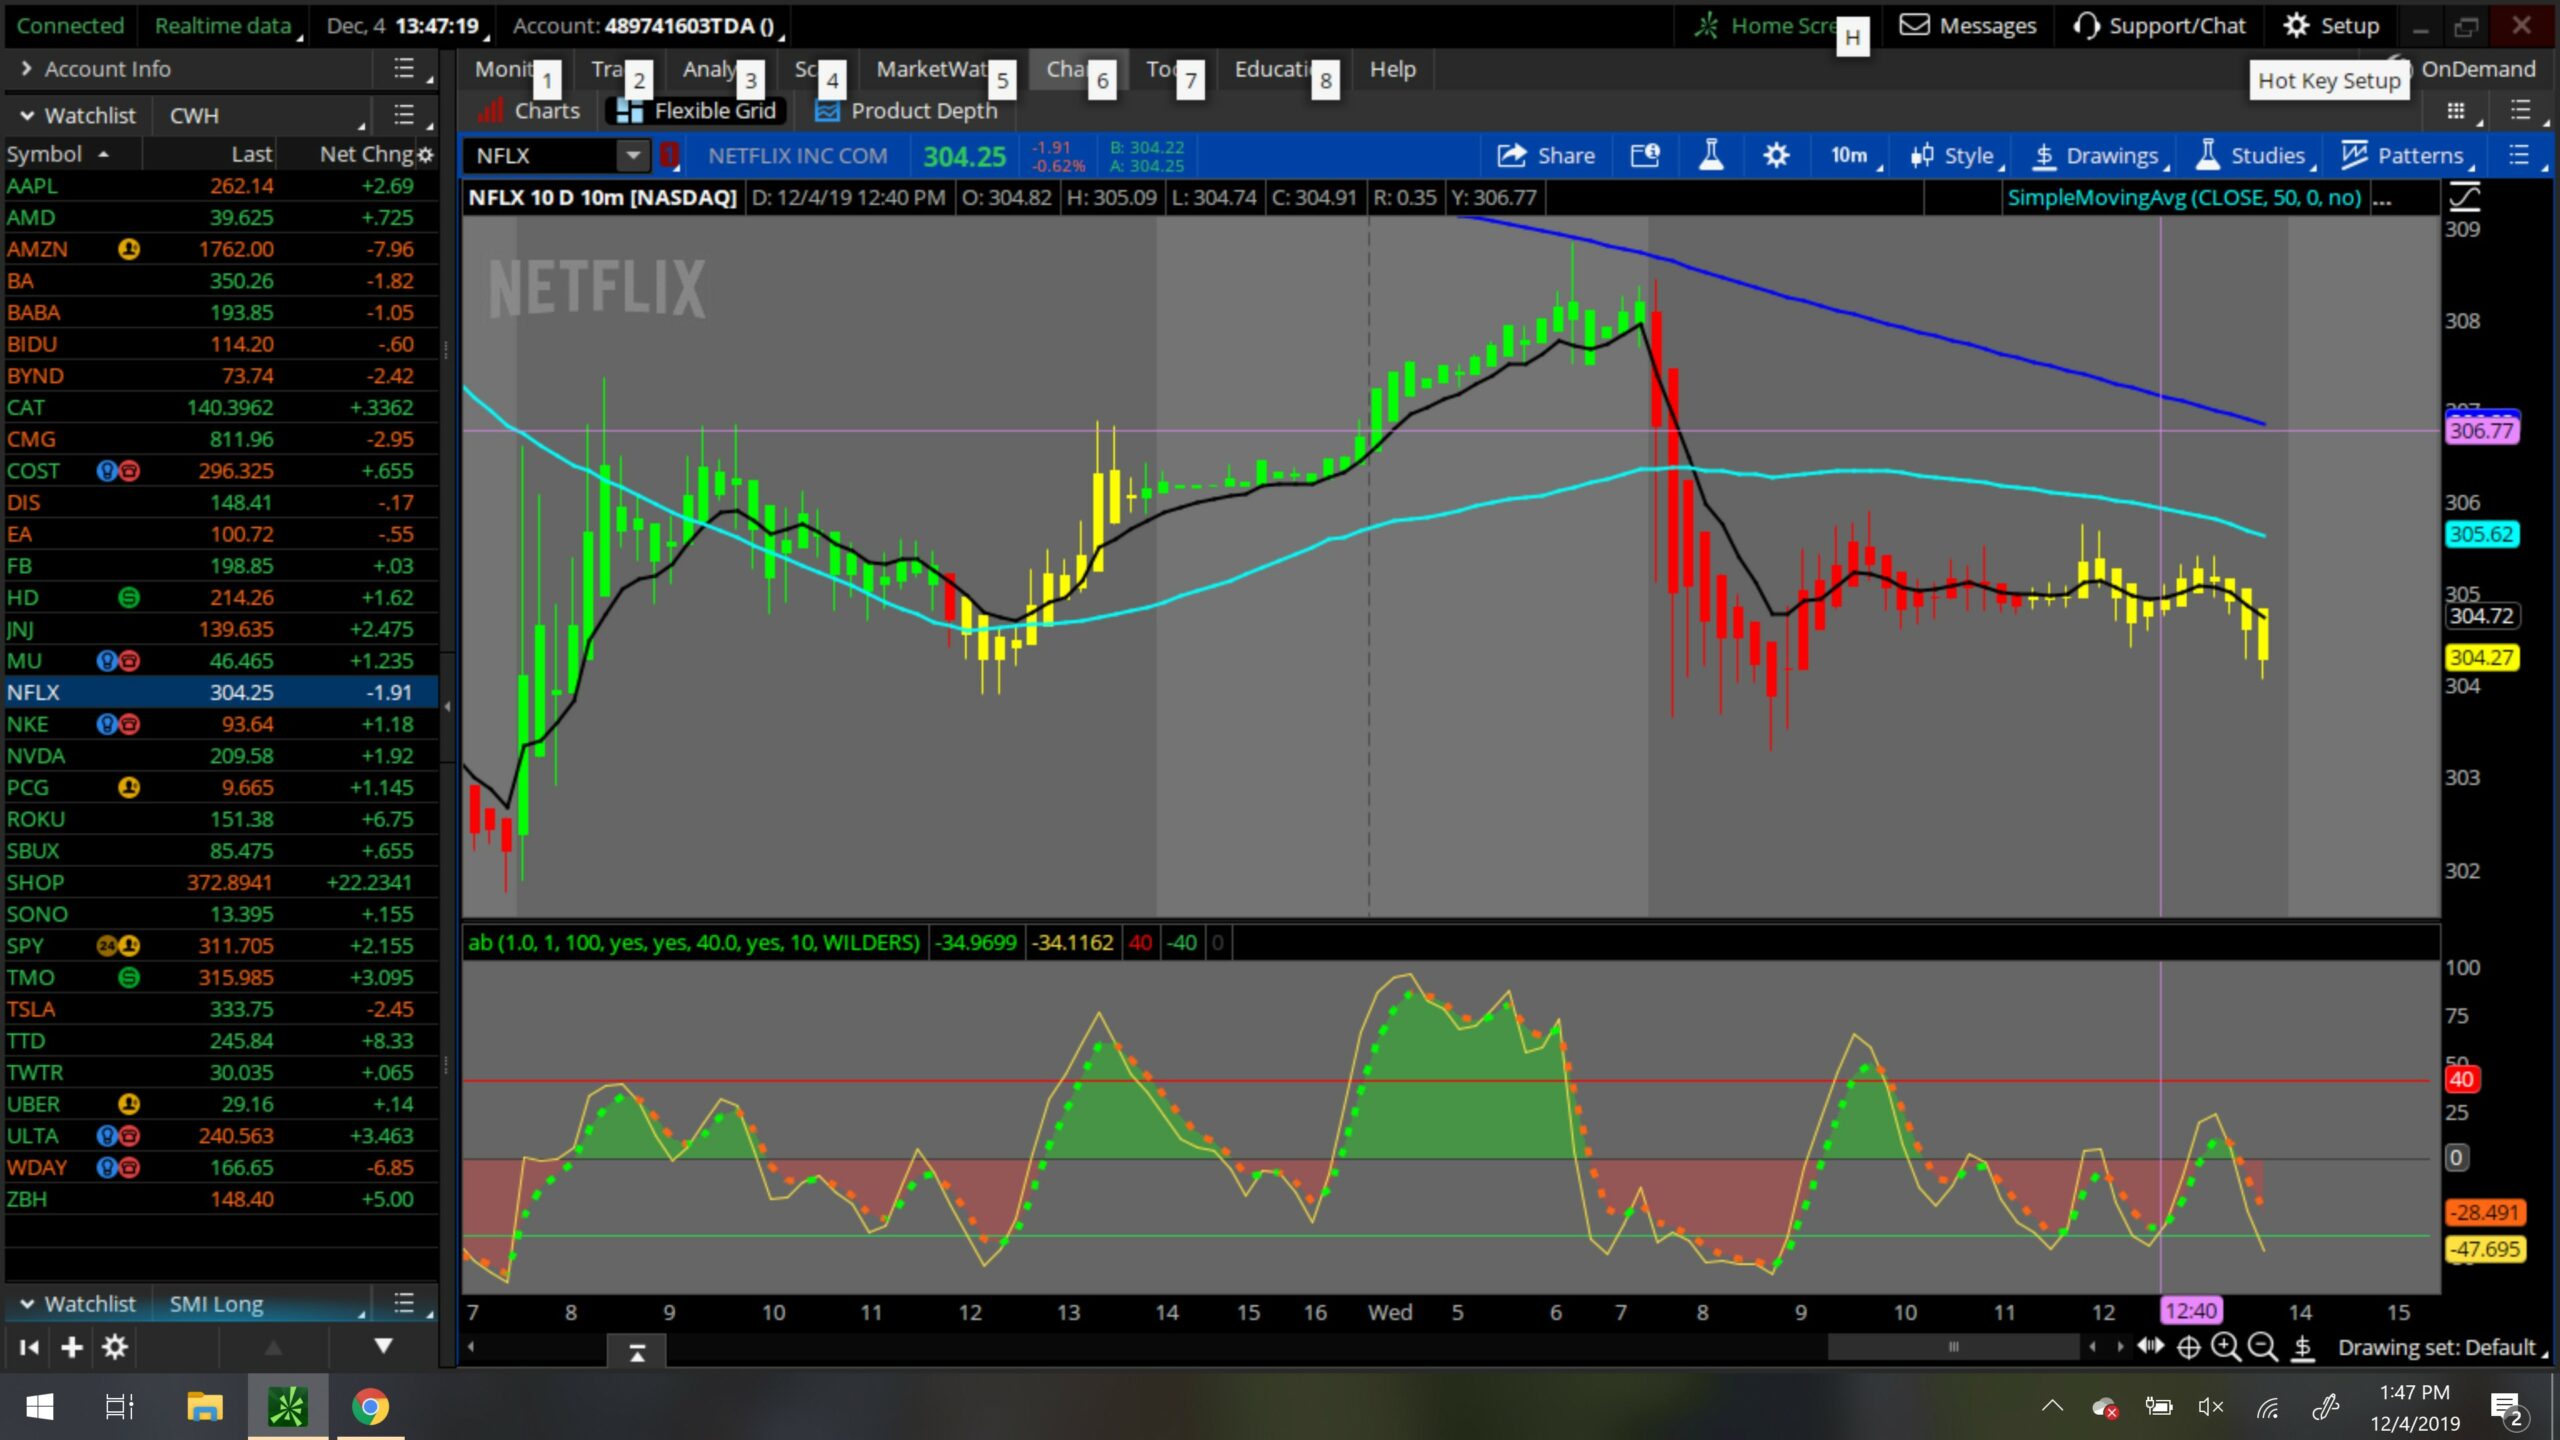
Pete

Could I get help with a scan from a lower study…Looking for two conditions in the scan…Green cloud and green dotted line for long sacn….Red cloud and red dotted line for short…


#Look for the Dashed lines to turn color and Avg line to cross the Dash line for an entry but with more risk, next entry when avg line and dashed color line crosses the 40 line. Next and probably the best risk is when the avg line and dashed line cross the zero line and Dashed line and cloud are the same color. I use this with a MACD crossover arrow setting at 5,13,4 or 5,13,6 or 3,13,6

#Not 100% on the ADX vertical line and histogram this might need to be adjusted to match a normal ADX line. The ADX vertical line can be turned off in the edit study. The hisotgram can be hidden as well.

#Use with the Upper matching MP_SMIandVerticalLineWarning System here>>> http://tos.mx/mDvxaX

#use setting gridsize .10 for/CL for tick charts and lower agg time frames and 1.0 for 1 hour and Daily.

declare lower;
#SMI engine
input gridsize = 1.0;
input aoscale = 1;
input smiscale = 100;
input audio = yes;
input label = yes;
input smilimit = 40.0;
input adxvline = yes;
def aofast = 5;
def aoslow = 34;

def percentDLength = 3;
def percentKLength = 5;
def smihull = 3;
def anglescalingfactor = 1 / gridsize;

def min_low = Lowest(low, percentKLength);
def max_high = Highest(high, percentKLength);
def rel_diff = close – (max_high + min_low) / 2;
def diffx = max_high – min_low;

def avgrel = ExpAverage(ExpAverage(rel_diff, percentDLength), percentDLength);
def avgdiff = ExpAverage(ExpAverage(diffx, percentDLength), percentDLength);
#plot SMI = if avgdiff != 0 then avgrel / (avgdiff / 2) * smiscale else 0;
plot SMI = ExpAverage( if avgdiff != 0 then avgrel / (avgdiff / 2) * smiscale else 0, 3);
#smi.setDefaultColor(getColor(1));
SMI.DefineColor(“Up”, Color.GREEN);
SMI.DefineColor(“Down”, Color.DOWNTICK);
SMI.DefineColor(“flat”, Color.GRAY);
SMI.AssignValueColor(if SMI >= SMI[1] then SMI.Color(“up”) else SMI.Color(“down”));
SMI.SetLineWeight(4);
SMI.SetStyle(Curve.SHORT_DASH);

plot SMI1 = if avgdiff != 0 then avgrel / (avgdiff / 2) * smiscale else 0;
SMI1.SetDefaultColor(Color.GRAY);

plot upper = smilimit;
upper.SetDefaultColor(Color.BLUE);

plot lower = -smilimit;
lower.SetDefaultColor(Color.BLUE);

# Awesome Oscillator

plot Zero = 0;
Zero.SetDefaultColor(Color.DARK_GRAY);

#AddCloud(SMI, smilimit, Color.GREEN, Color.LIGHT_GRAY);
#AddCloud(-smilimit, SMI, Color.RED, Color.LIGHT_GRAY);
AddCloud(SMI, 0, Color.GREEN, CreateColor(255, 50, 50));

Alert(audio and SMI crosses above 0, “SMI Long”, Alert.BAR, Sound.Ring);
Alert(audio and SMI crosses below 0, “SMI Short”, Alert.BAR, Sound.Ring);
Alert(audio and SMI crosses smilimit, “”, Alert.BAR, Sound.Bell);
upper.SetDefaultColor(Color.RED);
#upper.SetStyle(Curve.SHORT_DASH);
lower.SetDefaultColor(Color.UPTICK);
#lower.SetStyle(Curve.SHORT_DASH);

#adx histogram
input length = 10;
input averageType = AverageType.WILDERS;

plot ADX = (DMI(length, averageType).ADX) – 18;
ADX.SetPaintingStrategy(PaintingStrategy.HISTOGRAM);
ADX.SetLineWeight(1);
ADX.DefineColor(“Up”, Color.BLUE);
ADX.DefineColor(“Down”, Color.DARK_ORANGE);
ADX.AssignValueColor(
if ADX >= ADX[1] then ADX.Color(“up”)
else ADX.Color(“down”));
plot adxcaut = 20;
adxcaut.SetDefaultColor(Color.DARK_ORANGE);

Attachments:
Marked as spam
Posted by (Questions: 49, Answers: 42)
Asked on December 4, 2019 1:49 pm
171 views
0
Pete...I couldn't find previous bar...I used greater than close....And second part is it less than zero line or value 0
( at December 4, 2019 4:14 pm)
0
Did you watch the video?
( at December 4, 2019 7:12 pm)
0
Got it
( at December 5, 2019 2:00 pm)
0
Private answer

If you only want the scan based on the SMI you don't need any of this code to do that. You can build this using the condition wizard and reference the built-in study named: "StochasticMomentumIndex" and the plot from that indicator named "SMI".

The rules are very simple:

  1. Red cloud and red dashed line = SMI less than previous bar and less than zero
  2. Green cloud and green dashed line = SMA greater than or equal to previous bar and greater than zero

So you build each signal separately and each consists of only two conditions in the Condition Wizard. No custom code required and all you have to do is point and click.

This video explains how to build several scans using the condition wizard:

https://www.hahn-tech.com/thinkorswim-condition-wizard/

The only reason you would need to use the code you provided instead of the Condition Wizard is if your scan required the use of some other elements in that custom code.

Marked as spam
Posted by (Questions: 37, Answers: 4090)
Answered on December 4, 2019 3:23 pm