| ♥ 0 |
How can I make a simple moving average for two different stocks? Here is an example: Stock1 = AAPL Stock2 =AMZN (closeofstock1 + closeofstock2)/2 (144 + 925)/2 = 534.50 Thanks!
Marked as spam
Asked on April 28, 2017 7:24 pm
116 views
|
|
Private answer
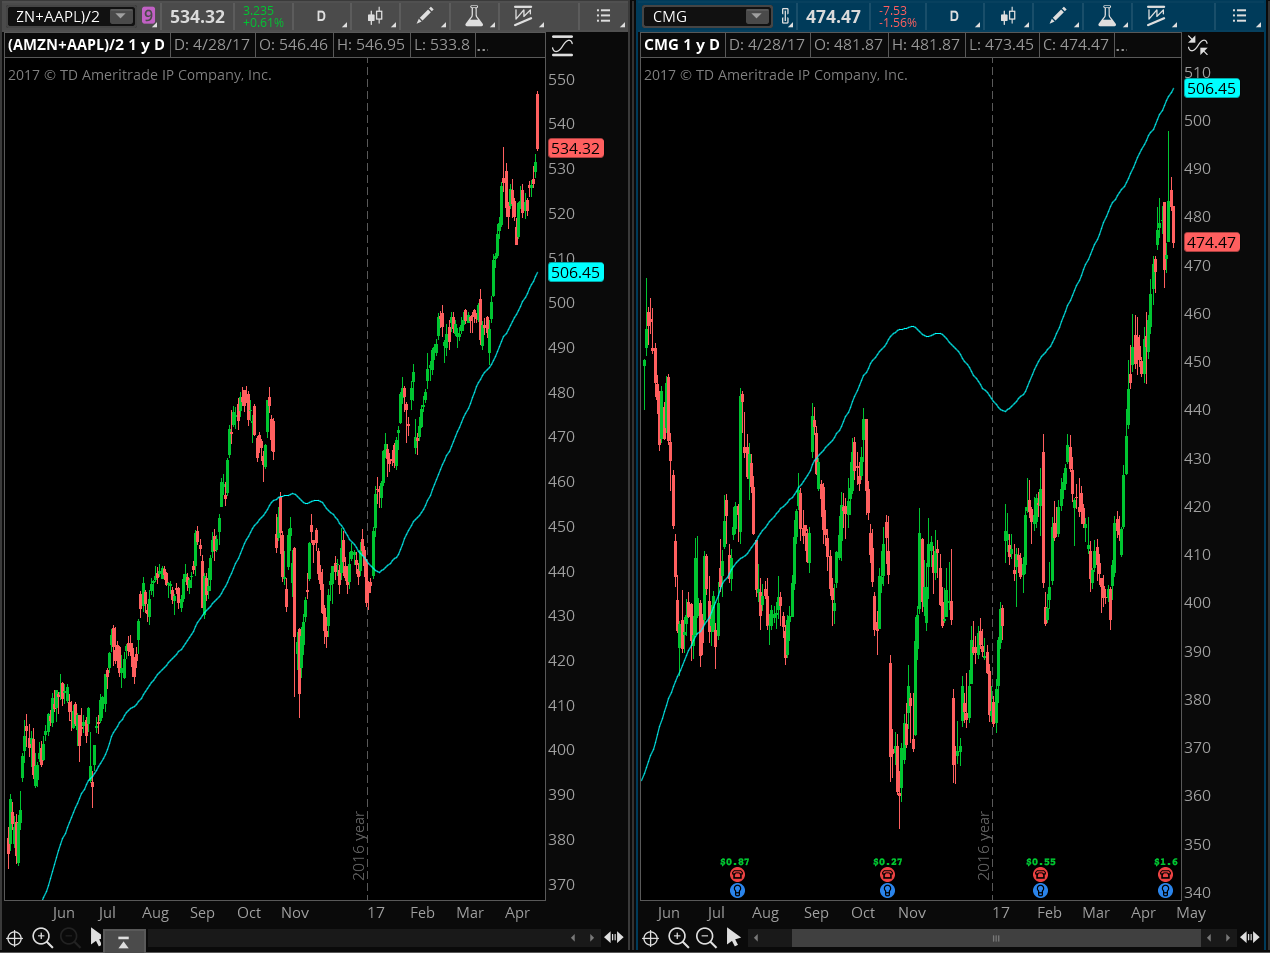
Well there is one very simple way that requires absolutely no code at all. You simply put this in the place for the ticker symbol of the chart. (AMZN + AAPL) / 2 I’ve done that with as many as 7 stocks, to create my own custom index. Now this will plot price bars that are the average of those two ticker symbols. And every indicator you place on the chart will read from those averaged price bars. If you need to plot the moving average on a chart without changing the price bars on the chart. For example to plot the moving average of AAPL and AMZN on a chart of QQQ or some other symbol. That will require custom code:
Parts of this code were adapted from the example given here: http://toslc.thinkorswim.com/center/reference/thinkScript/Functions/Fundamentals/close.html Screenshot shows both results. On the left is the low tech solution and on the right is the code solution. I will say the code solution has very limited usefulness. I had to plot this on a chart of CMG which just so happens to be trading within the range of this composite moving average. Attachments:
Marked as spam
Answered on April 29, 2017 9:29 am
|
Wow…. Thank you so much! Your post was very, very useful! ?