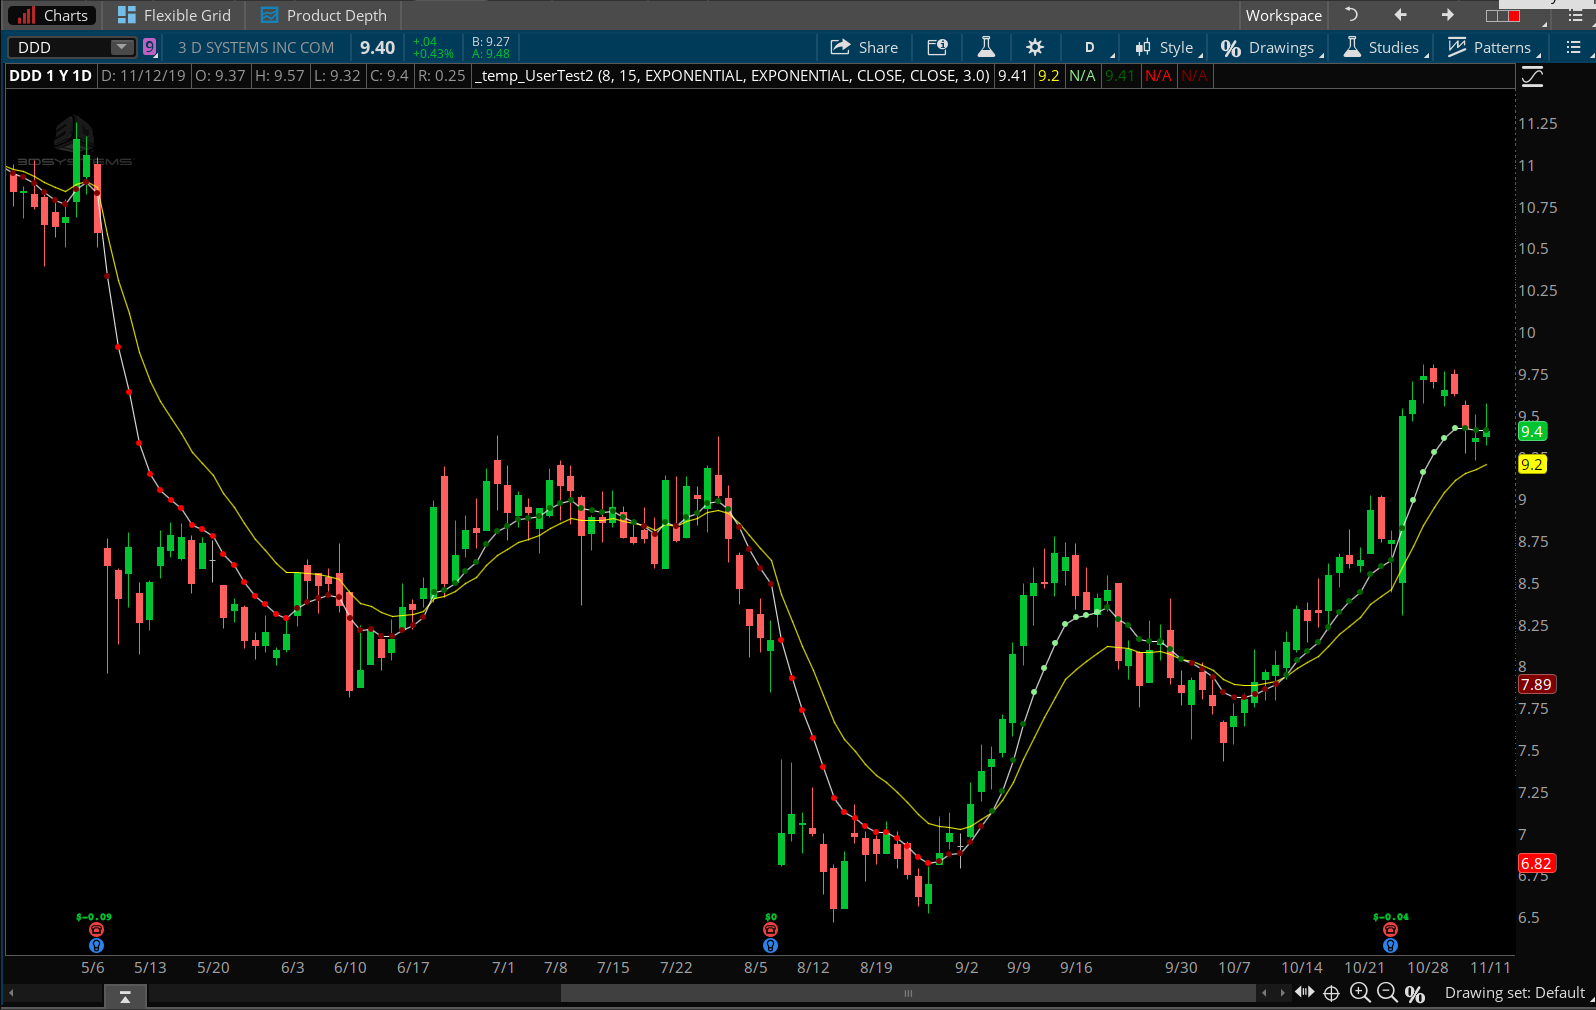
The author of the post provided some details so we can now provide a specific solution. I have a request from another post for just the opposite of this. So I took the time to build a solution that would be flexible enough to work for the entire audience.
This covers all four potential conditions:
- ma one above ma two while less than x percent away
- ma one above ma two while more than x percent away
- ma one below ma two while less than x percent away
- ma one below ma two while more than x percent away
The two ma's are plotted on the chart study. Dots are plotted for every bar on the chart to show the current relationship between the two moving averages. From the bullet point list above, the dots are colored as follows:
- dark green
- light green
- dark red
- light red
You can turn plots off as needed and change any color through the edit studies window. You can also adjust the length, type and price for each moving average. Here is the code and the screenshot below shows the result:
input lengthOne = 8;

input lengthTwo = 15;

input maTypeOne = AverageType.EXPONENTIAL;

input maTypeTwo = AverageType.EXPONENTIAL;

input maPriceOne = close;

input maPriceTwo = close;

input percentDiff = 3.0;

plot maOne = MovingAverage(maTypeOne, maPriceOne, lengthOne);

maOne.SetDefaultColor(Color.WHITE);

plot maTwo = MovingAverage(maTypeTwo, maPriceTwo, lengthTwo);

maTwo.SetDefaultColor(Color.YELLOW);

plot maAboveMoreThanPercent = if maOne > maTwo * (1 + percentDiff * 0.01) then maOne else Double.NaN;

maAboveMoreThanPercent.SetPaintingStrategy(PaintingStrategy.POINTS);

maAboveMoreThanPercent.SetLineWeight(3);

maAboveMoreThanPercent.SetDefaultColor(Color.LIGHT_GREEN);

plot maAboveLessThanPercent = if maOne > maTwo and maOne < maTwo * (1 + percentDiff * 0.01) then maOne else Double.NaN;

maAboveLessThanPercent.SetPaintingStrategy(PaintingStrategy.POINTS);

maAboveLessThanPercent.SetLineWeight(3);

maAboveLessThanPercent.SetDefaultColor(Color.DARK_GREEN);

plot maBelowMoreThanPercent = if maOne < maTwo * (1 - percentDiff * 0.01) then maOne else Double.NaN;

maBelowMoreThanPercent.SetPaintingStrategy(PaintingStrategy.POINTS);

maBelowMoreThanPercent.SetLineWeight(3);

maBelowMoreThanPercent.SetDefaultColor(Color.RED);

plot maBelowLessThanPercent = if maOne < maTwo and maOne > maTwo * (1 - percentDiff * 0.01) then maOne else Double.NaN;

maBelowLessThanPercent.SetPaintingStrategy(PaintingStrategy.POINTS);

maBelowLessThanPercent.SetLineWeight(3);

maBelowLessThanPercent.SetDefaultColor(Color.DARK_RED);
I understand that some might like to run this as a scan. So I'll also include the code you can use to scan for these conditions:
input lengthOne = 8;

input lengthTwo = 15;

input maTypeOne = AverageType.EXPONENTIAL;

input maTypeTwo = AverageType.EXPONENTIAL;

input maPriceOne = close;

input maPriceTwo = close;

input percentDiff = 3.0;

def maOne = MovingAverage(maTypeOne, maPriceOne, lengthOne);

def maTwo = MovingAverage(maTypeTwo, maPriceTwo, lengthTwo);

# scan for ma one above ma two while less than x percent away

plot maAboveMoreThanPercent = maOne > maTwo * (1 + percentDiff * 0.01);

# scan for ma one above ma two while more than x percent away

#plot maAboveLessThanPercent = maOne > maTwo and maOne < maTwo * (1 + percentDiff * 0.01);

# scan for ma one below ma two while less than x percent away

#plot maBelowMoreThanPercent = maOne < maTwo * (1 - percentDiff * 0.01);

# scan for ma one below ma two while more than x percent away

#plot maBelowLessThanPercent = maOne < maTwo and maOne > maTwo * (1 - percentDiff * 0.01);