| ♥ 0 |
Hey Pete, Someone on tradingview made a cool MTF script and the code is available to see. However, I\’m not sure how to convert from pine (tradingview) to thinkscript. Would you be able to help?
Thanks
Marked as spam
Asked on April 22, 2018 7:05 am
420 views
|
|
Private answer
Hey Pete, sorry for the late reply just saw this now. Here is the code:
tf1=input(‘5’, title=”Short TF 1″) tf2=input(’10’, title=”Short TF 2″) tf3=input(’15’, title=”Short TF 3″) tf4=input(’30’, title=”Short TF 4″) tf5=input(’60’, title=”Medium TF 1″) tf6=input(‘120’, title=”Medium TF 2″) tf7=input(‘240’, title=”Medium TF 3″) tf8=input(‘D’, title=”Long TF 1″) tf9=input(‘W’, title=”Long TF 2″) tf10=input(‘M’, title=”Long TF 3″) high1=security(tickerid, tf1, high) high11=security(tickerid, tf1, high[1]) high2=security(tickerid, tf2, high) high22=security(tickerid, tf2, high[1]) high3=security(tickerid, tf3, high) high33=security(tickerid, tf3, high[1]) high4=security(tickerid, tf4, high) high44=security(tickerid, tf4, high[1]) high5=security(tickerid, tf5, high) high55=security(tickerid, tf5, high[1]) high6=security(tickerid, tf6, high) high66=security(tickerid, tf6, high[1]) high7=security(tickerid, tf7, high) high77=security(tickerid, tf7, high[1]) high8=security(tickerid, tf8, high) high88=security(tickerid, tf8, high[1]) high9=security(tickerid, tf9, high) high99=security(tickerid, tf9, high[1]) high10=security(tickerid, tf10, high) high101=security(tickerid, tf10, high[1]) low1=security(tickerid, tf1, low) low11=security(tickerid, tf1, low[1]) low2=security(tickerid, tf2, low) low22=security(tickerid, tf2, low[1]) low3=security(tickerid, tf3, low) low33=security(tickerid, tf3, low[1]) low4=security(tickerid, tf4, low) low44=security(tickerid, tf4, low[1]) low5=security(tickerid, tf5, low) low55=security(tickerid, tf5, low[1]) low6=security(tickerid, tf6, low) low66=security(tickerid, tf6, low[1]) low7=security(tickerid, tf7, low) low77=security(tickerid, tf7, low[1]) low8=security(tickerid, tf8, low) low88=security(tickerid, tf8, low[1]) low9=security(tickerid, tf9, low) low99=security(tickerid, tf9, low[1]) low10=security(tickerid, tf10, low) low101=security(tickerid, tf10, low[1]) c=iff(high>high[1] and low>low[1], 1, iff(high<high[1] and low<low[1], 2, 3)) c1=iff(high1>high11 and low1>low11, 1, iff(high1<high11 and low1<low11, 2, 3)) c2=iff(high2>high22 and low2>low22, 1, iff(high2<high22 and low2<low22, 2, 3)) c3=iff(high3>high33 and low3>low33, 1, iff(high3<high33 and low3<low33, 2, 3)) c4=iff(high4>high44 and low4>low44, 1, iff(high4<high44 and low4<low44, 2, 3)) c5=iff(high5>high55 and low5>low55, 1, iff(high5<high55 and low5<low55, 2, 3)) c6=iff(high6>high66 and low6>low66, 1, iff(high6<high66 and low6<low66, 2, 3)) c7=iff(high7>high77 and low7>low77, 1, iff(high7<high77 and low7<low77, 2, 3)) c8=iff(high8>high88 and low8>low88, 1, iff(high8<high88 and low8<low88, 2, 3)) c9=iff(high9>high99 and low9>low99, 1, iff(high9<high99 and low9<low99, 2, 3)) c10=iff(high10>high101 and low10>low101, 1, iff(high10<high101 and low10<low101, 2, 3)) sig1=iff(c==1 and c1==1 and c2==1 and c3==1 and c4==1, 1, iff(c==2 and c1==2 and c2==2 and c3==2 and c4==2, 2, 3)) sig2=iff(c==1 and c5==1 and c6==1 and c7==1, 1, iff(c==2 and c5==2 and c6==2 and c7==2, 2, 3)) sig3=iff(c==1 and c8==1 and c9==1 and c10==1, 1, iff(c==2 and c8==2 and c9==2 and c10==2, 2, 3)) signal=iff(sig1==1 and sig2==1 and sig3==1, 1, iff(sig1==2 and sig2==2 and sig3==2, 2, 3)) plot(15, title=”Current TF”, color=iff(c==1, blue, iff(c==2, black, white)), style=circles, linewidth=5, join=true) plot(12, title=”TF 1″, color=iff(c1==1, blue, iff(c1==2, black, white)), style=circles, linewidth=3, join=true) plot(11, title=”TF 2″, color=iff(c2==1, blue, iff(c2==2, black, white)), style=circles, linewidth=3, join=true) plot(10, title=”TF 3″, color=iff(c3==1, blue, iff(c3==2, black, white)), style=circles, linewidth=3, join=true) plot(9, title=”TF 4″, color=iff(c4==1, blue, iff(c4==2, black, white)), style=circles, linewidth=3, join=true) plot(7, title=”TF 5″, color=iff(c5==1, blue, iff(c5==2, black, white)), style=circles, linewidth=3, join=true) plot(6, title=”TF 6″, color=iff(c6==1, blue, iff(c6==2, black, white)), style=circles, linewidth=3, join=true) plot(5, title=”TF 7″, color=iff(c7==1, blue, iff(c7==2, black, white)), style=circles, linewidth=3, join=true) plot(3, title=”TF 8″, color=iff(c8==1, blue, iff(c8==2, black, white)), style=circles, linewidth=3, join=true) plot(2, title=”TF 9″, color=iff(c9==1, blue, iff(c9==2, black, white)), style=circles, linewidth=3, join=true) plot(1, title=”TF 10″, color=iff(c10==1, blue, iff(c10==2, black, white)), style=circles, linewidth=3, join=true) plot(8, title=”Short TF Signal”, color=iff(sig1==1, green, iff(sig1==2, red, white)), style=cross, linewidth=4) plot(4, title=”Medium TF Signal”, color=iff(sig2==1, green, iff(sig2==2, red, white)), style=cross, linewidth=4) plot(0, title=”Long TF Signal”, color=iff(sig3==1, green, iff(sig3==2, red, white)), style=cross, linewidth=4) plot(-1, title=”Signal”, color=iff(signal==1, green, iff(signal==2, red, white)), style=circles, linewidth=5) Marked as spam
Answered on April 26, 2018 12:09 pm
|
|||||||||
|
Private answer
Since Giuseppe has clarified the request to include a small subsection of the entire indicator I have the following solution. Giuseppe has requested just the section of code that plots the “Long TF Signal”, which consists of Daily, Weekly and Monthly time frames. The time frames are inputs which can be adjusted as needed. First, I will provide that portion of TradingView code I used for the conversion:
And here is the translation of that code into Thinkorswim:
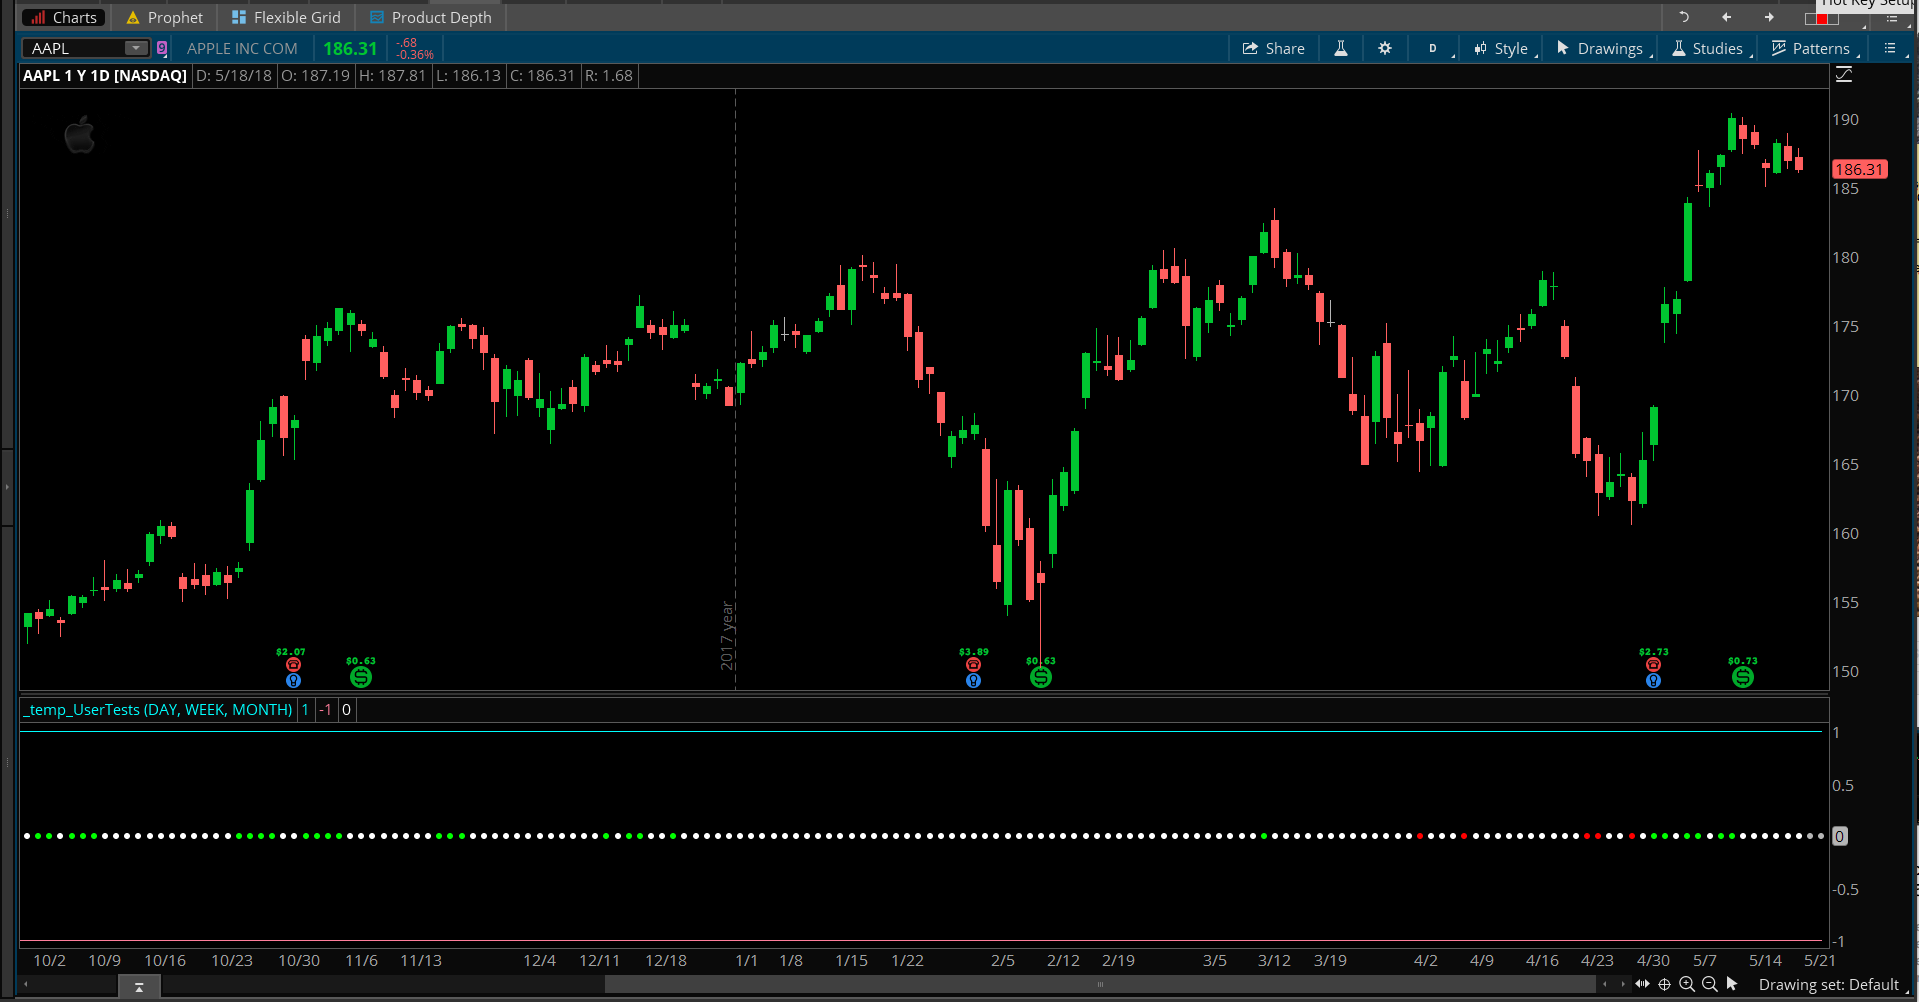
Screenshot below shows the final result. Attachments:
Marked as spam
Answered on May 18, 2018 1:48 pm
|
I can, and I have. In fact we have at least one post in the Q&A forum on this topic. However MTF studies can get a bit complicated. Which means I may not do this for free in the Q&A forum. It may end up being a paid custom project. But I need to see it first. You didn’t provide a link? Or source code?
Hello? Anyone out there?