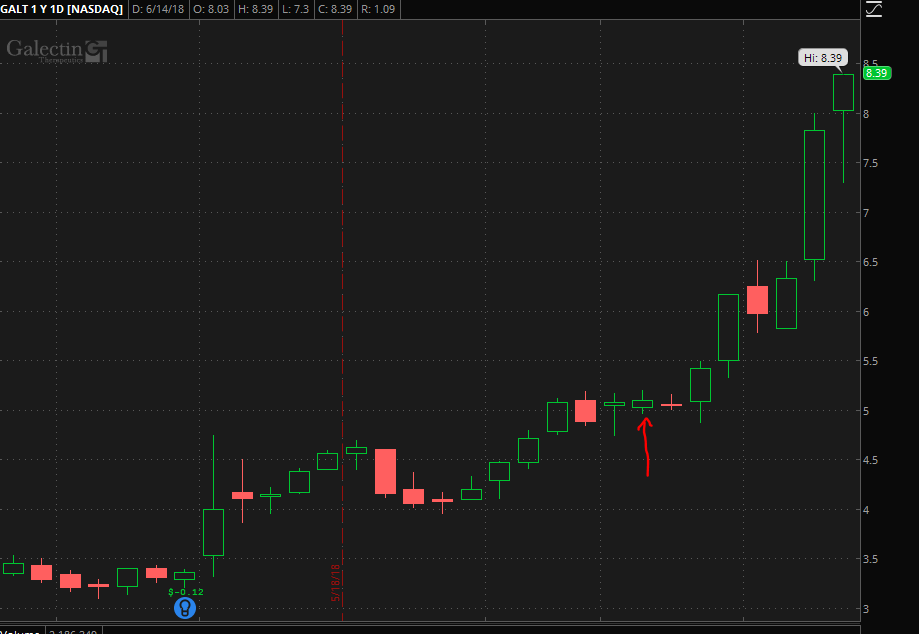
Your chart screenshot was perfect. You provided the full chart view, including the ticker symbol and time frame. This is great. Nobody seems to be able to accomplish this when posting new questions. So I wanted to take the time to give you some praise for that.
From your screenshot, I see you have 1 year of daily bars loaded on the chart. The scan will have access to two years of daily data. So we need to make sure we restrict this formula to look back only 252 daily bars for the previous highest close.
I had originally tried to present a solution to this using the condition wizard. However it has occurred to me that we are lacking one very small item using that tool. The problem has to do with how we compare the current bar’s close the the highest close in the previous 252 daily bars. We need to exclude the current bar from the “Highest” close in one year.
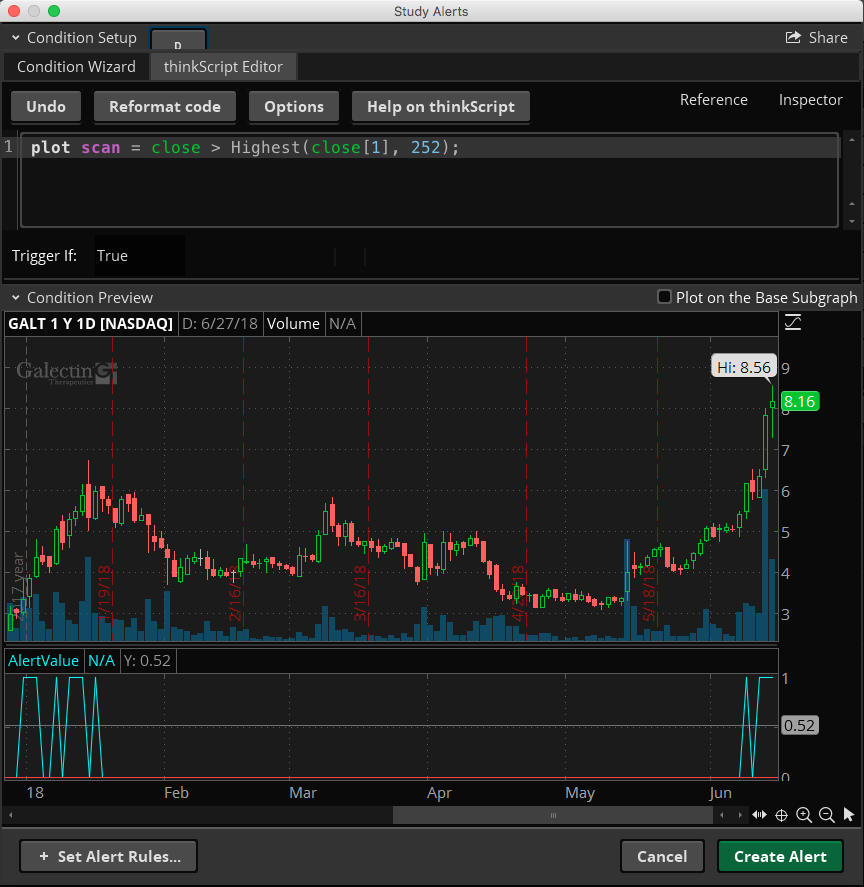
The scan consists of a single line of code:
plot scan = close > Highest(close[1], 252);
Screenshot below shows what it looks like when applied to a Study Alert. Which is one of the best places to experiment with code you intend to use for scans. The true/false conditions are automatically plotted on the lower subgraph of the chart.
Thank you Pete,
Giuseppe
Hey Pete, sorry to ask again. What I meant was that I wanted the scan to show when a stocks close crosses above its previous close(s) (not the high). For example in the picture I posted above, I drew a red arrow of where the stocks close crossed above its previous closes but not the highs. I’m trying to change the parameter to “close” but its not working.