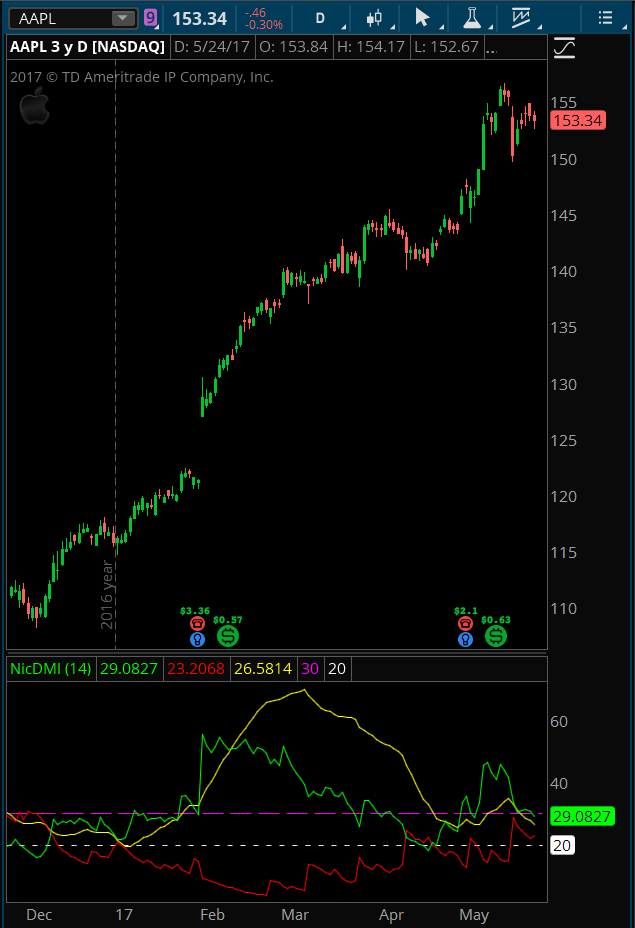
Yep, sure thing. Here is the code for that study. Nothing special about other than aesthetics. The values are exactly the same as the original. Screenshot included so you can see what it looks like.
The indicator colors the DI+ green, the DI- red and the ADX line in yellow. It also includes two horizontal lines, one at 20 (white) and the other at 30 (magenta). I created this for a friend who wanted to have those levels plotted on the indicator without having to draw them in. Enjoy!
declare lower;

input length = 14;

def hiDiff = high - high[1];

def loDiff = low[1] - low;

def plusDM = if hiDiff > loDiff and hiDiff > 0 then hiDiff else 0;

def minusDM =  if loDiff > hiDiff and loDiff > 0 then loDiff else 0;

def ATR = WildersAverage(TrueRange(high, close, low), length);

plot "DI+" = 100 * WildersAverage(plusDM, length) / ATR;

"DI+".SetDefaultColor(color.GREEN);

plot "DI-" = 100 * WildersAverage(minusDM, length) / ATR;

"DI-".SetDefaultColor(color.RED);

def DX = if ("DI+" + "DI-" > 0) then 100 * AbsValue("DI+" - "DI-") / ("DI+" + "DI-") else 0;

plot ADX = WildersAverage(DX, length);

ADX.SetDefaultColor(color.YELLOW);

plot line1 = 30;

line1.SetStyle(Curve.LONG_DASH);

line1.SetDefaultColor(color.MAGENTA);

plot line = 20;

line.SetdefaultColor(color.WHITE);

line.SetStyle(Curve.SHORT_DASH);
Thank you very much – awesome.