Plot Historical Implied Volatility for individual strike


Category:
0
0

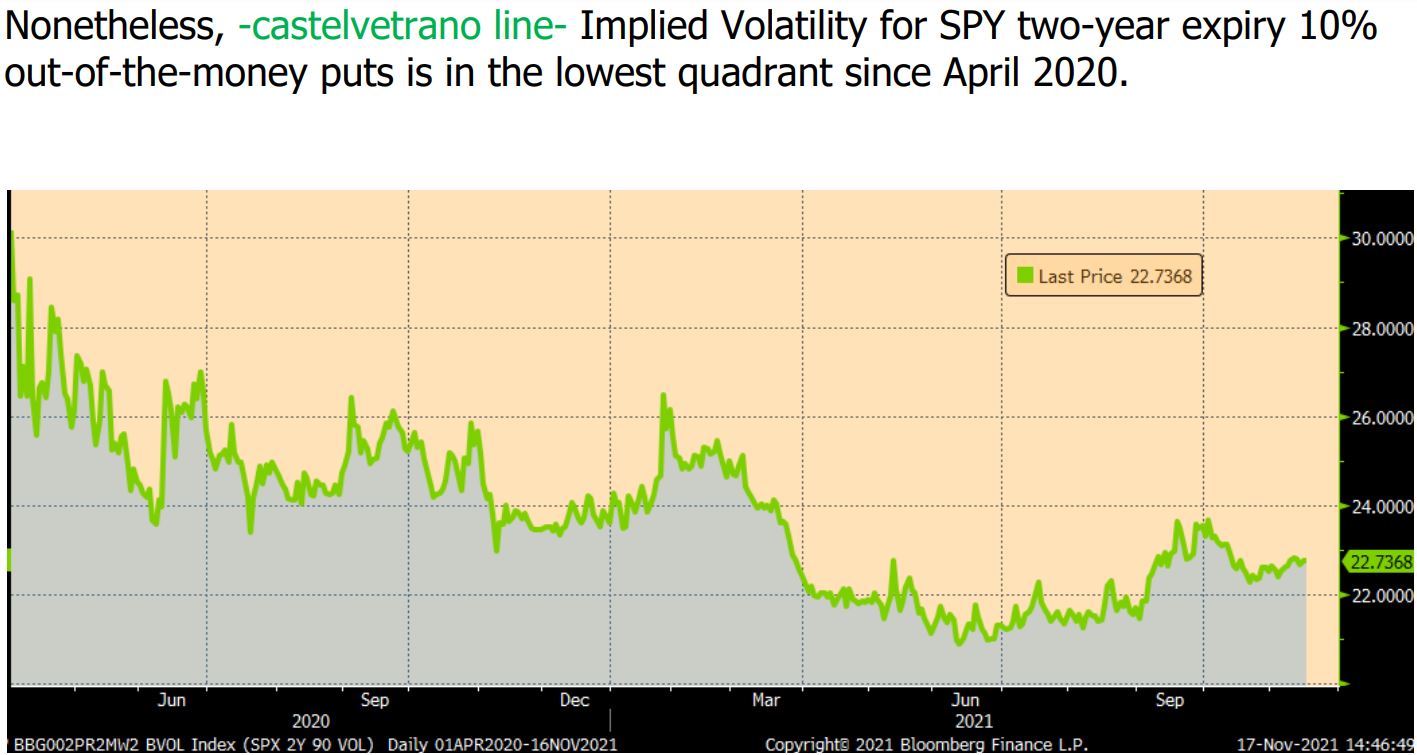
Hi Hahn,

I came across your youtube videos about TOS tutorials and are having a blast. Recently i read an article and saw Bloomberg Terminal has a function of displaying historical chart of an individual strike’s Implied volatility since option became listed. I am curious if you could provide any insights on how to achieve this, please see attachment as an example. I played around TOS thinkback as well as TOS charts studies for single option quote historical IV chart but could not find any methods of plotting the chart. Thanks!


Harry

Attachments:
Marked as spam
Posted by (Questions: 1, Answers: 0)
Asked on December 1, 2021 11:51 pm
74 views
0
Private answer

Sorry but in the current version of Thinkorswim this is not possible. The platform does not have data points or data streams for Implied Volatility on individual options contracts.

If and when that data does become available there will be no need for a custom solution. The built-in chart study named ImpVolatility will do the job. But the data must first be provided by the platform.

Any users of Thinkorswim who feel this is a very important feature to include on the platform should submit a feature request to TD Ameritrade support.

Marked as spam
Posted by (Questions: 37, Answers: 4089)
Answered on December 2, 2021 7:39 am