| ♥ 0 |
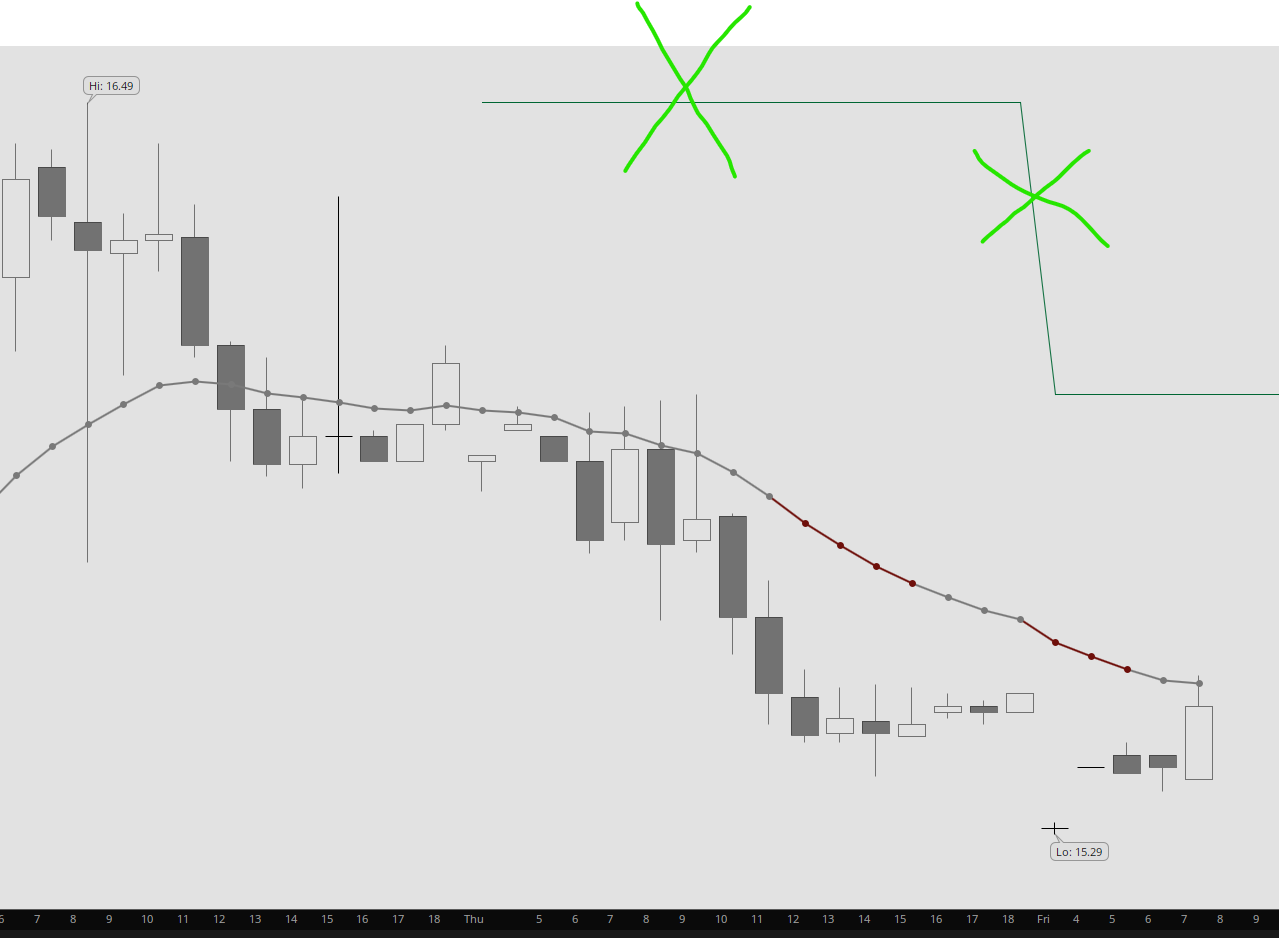
Hi, is there anyway to fix the plotted line so it’s either not showing the day from 2 days ago or removing the angled portion of it? I think the screenshot should help =====code============= input aggregationPeriod = AggregationPeriod.DAY; Thank you Attachments:
Marked as spam
|
|
Private answer
I updated the title of your question so that is fully describes what you are requesting. The title you entered does not help the rest of our viewers to understand the context before viewing the post. More importantly the title you entered would make it impossible for others to find this solution using the search function of the forum. Now that we have fixed that, we need to fix your code. Looks like it was patched together from some other studies and some of the variable names were misleading and others were completely unnecessary. This first section of code will solve the issue of the diagonal lines between trading sessions. The value still plots on each trading session but the diagonal line is taken out. If you want to know how that was accomplished, it was simply a style attribute we apply to the plot. Which you can do to your own code by adjusting the style of the plot through the Edit Studies window.
Now I will provide a new section of code that will allow you to display the plot for only the current trading session and you can change this behavior through user inputs.
Marked as spam
Answered on August 7, 2020 11:01 am
|