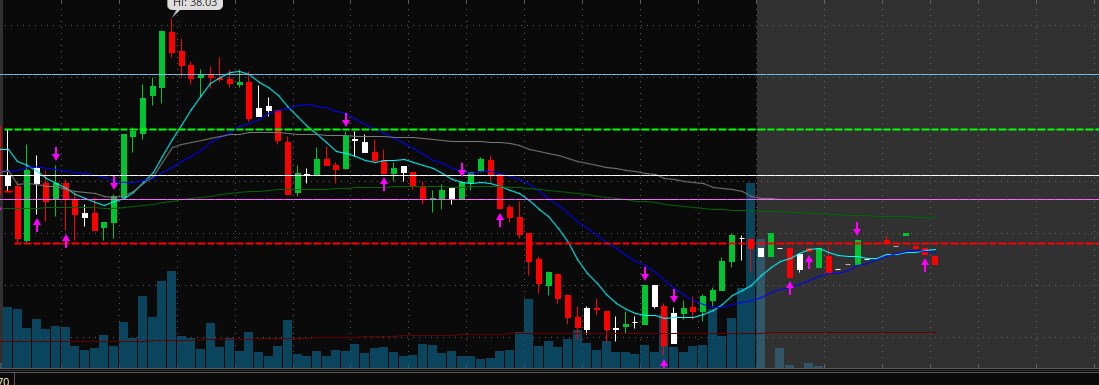
The only way you can do this is to create a loop that looks backward to find the last two signals and remove all the signals that came before them. There is no way for the code to know how many bars back it needs to look to find those two signals. So the code needs to loop through every single bar in the chart, backwards. And it needs to run that loop every time a price changes on the chart. The code itself is already running a loop from left to right. Now we have to add another loop that runs from right to left. The loop that runs from left to right is adding plots to the chart while the loop that runs from right to left is removing some of them. Sound like complete madness yet? It should, because it is.
The performance hit for doing something like this far out-ways the benefit of removing those extra signals. Especially for a trading platform that runs on the Java VM, especially for a trading platform that is already plagued by poor performance during heavy market activity, especially for a trading platform that uses a scripting language. I hope by now you get the idea.
The best solution we could apply in this environment is to declare a specified number of bars to the left of the last bar on the chart. Let's arbitrarily pick 20 bars. Then create a filter that is only true for the last 20 bars on the chart. We then use that filter as a true/false condition to limit any signals from plotting to only the last 20 bars on the chart.
input numberOfBars = 20;

def okToPlot = IsNaN(close[-numberOfBars]);
Now, how do you use that in your code?
plot signal = if okToPlot then open < ema1 and close > ema1 else no;

plot signal2 = if okToPlot then open > ema1 and close < ema1 else no;

