| ♥ 0 |
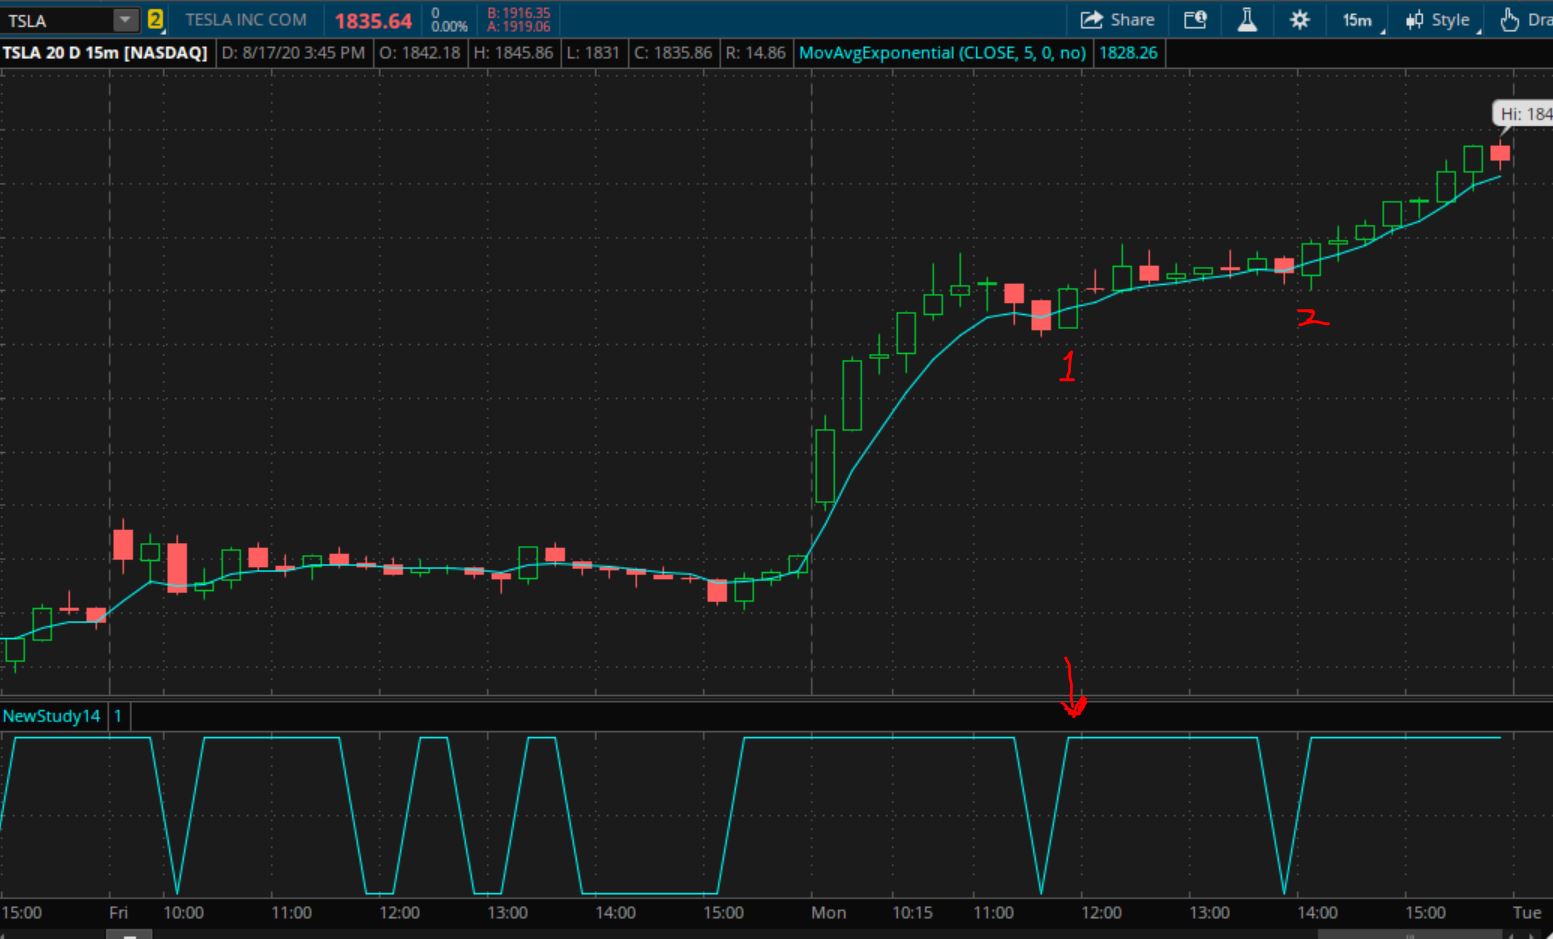
Hi Pete, Hope everything is well. I have a simple requirement, which I hope you could guide within your time allowance. I searched the forum but could not find any results. I am looking to plot only the first crossover in a day (regular trading hours). Here’s my simple code #——————————————————————————— def ema5 = reference MovAvgExponential(length=5); #——————————————————————————— This plots multiple times during the day, I want to plot only the first crossover. ( no. 1 in the screenshot) Appreciate your guidance. PS: The example here is for an EMA, but I hope the logic will hold for any crossovers. Thanks
Attachments:
Marked as spam
Asked on August 18, 2020 2:56 am
158 views
|
|
Private answer
The code you provided does not plot the crossover events but rather plots every time the close is greater than the moving average. We have already provided a solution to plot first occurrance during a trading session here: https://www.hahn-tech.com/ans/execute-trigger-once-daily/ You will find the example provided is generic so that it can be very easily applied to virtually any true/false "trigger" or condition. Also included in that post is a full explanation of how the code does it's job.
Marked as spam
Answered on August 18, 2020 8:35 am
|