| ♥ 0 |
hi I was wonder if there is a think script for psychological numbers, like a horizontal line on every 5, 10,20,50,100 points on SPX? I can’t find it on here. if there isn’t would you be willing till help create one please?
Marked as spam
Asked on August 31, 2023 8:09 am
133 views
|
|
Private answer
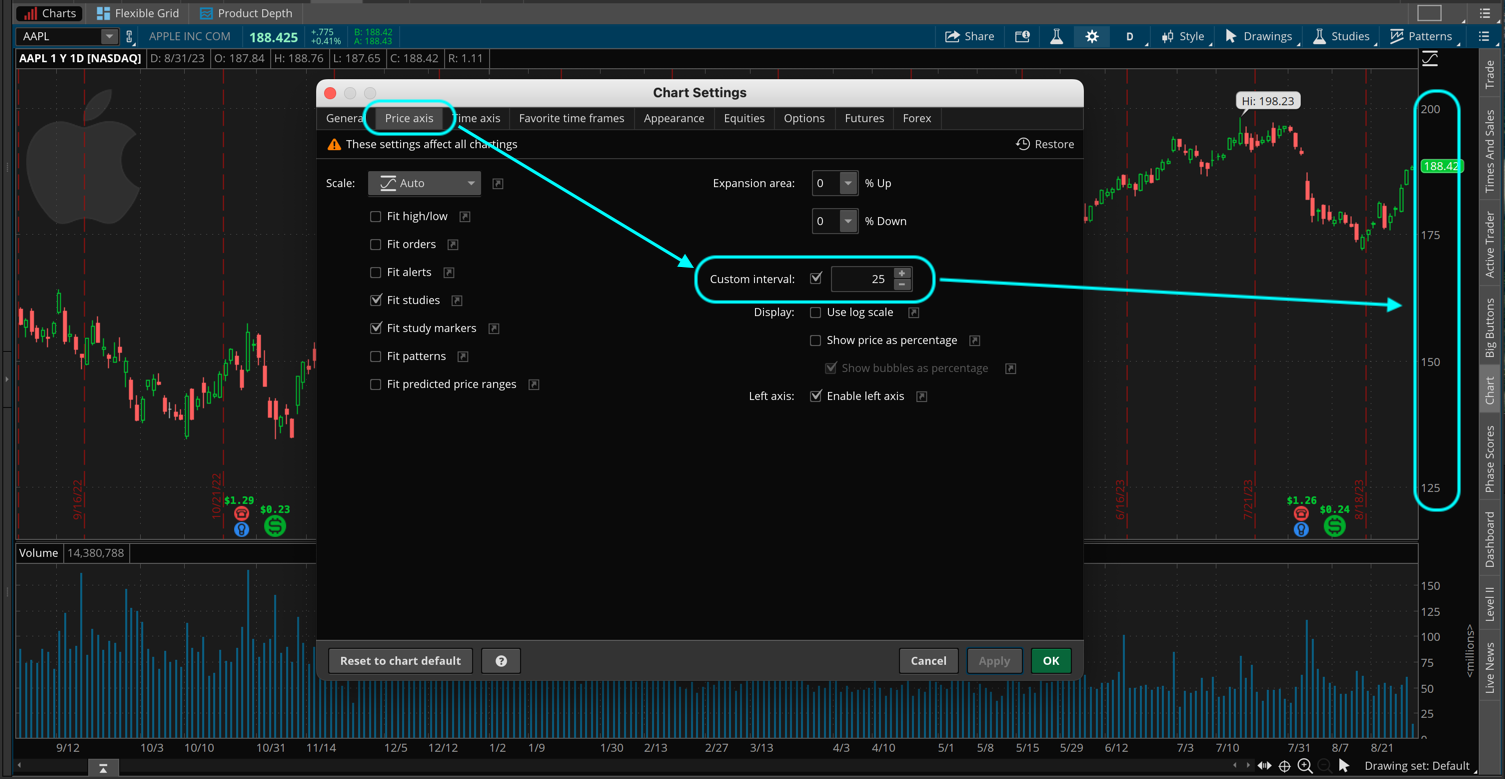
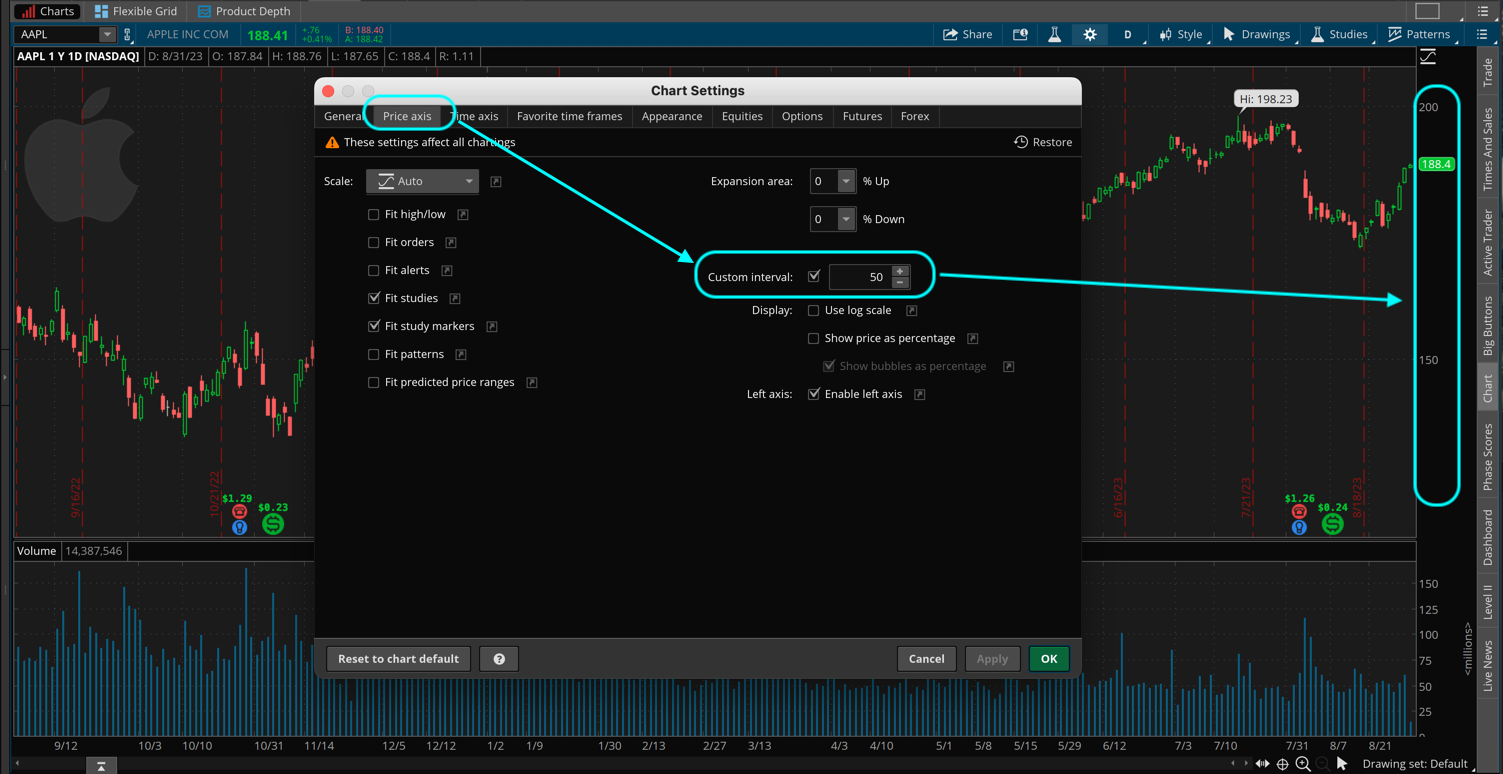
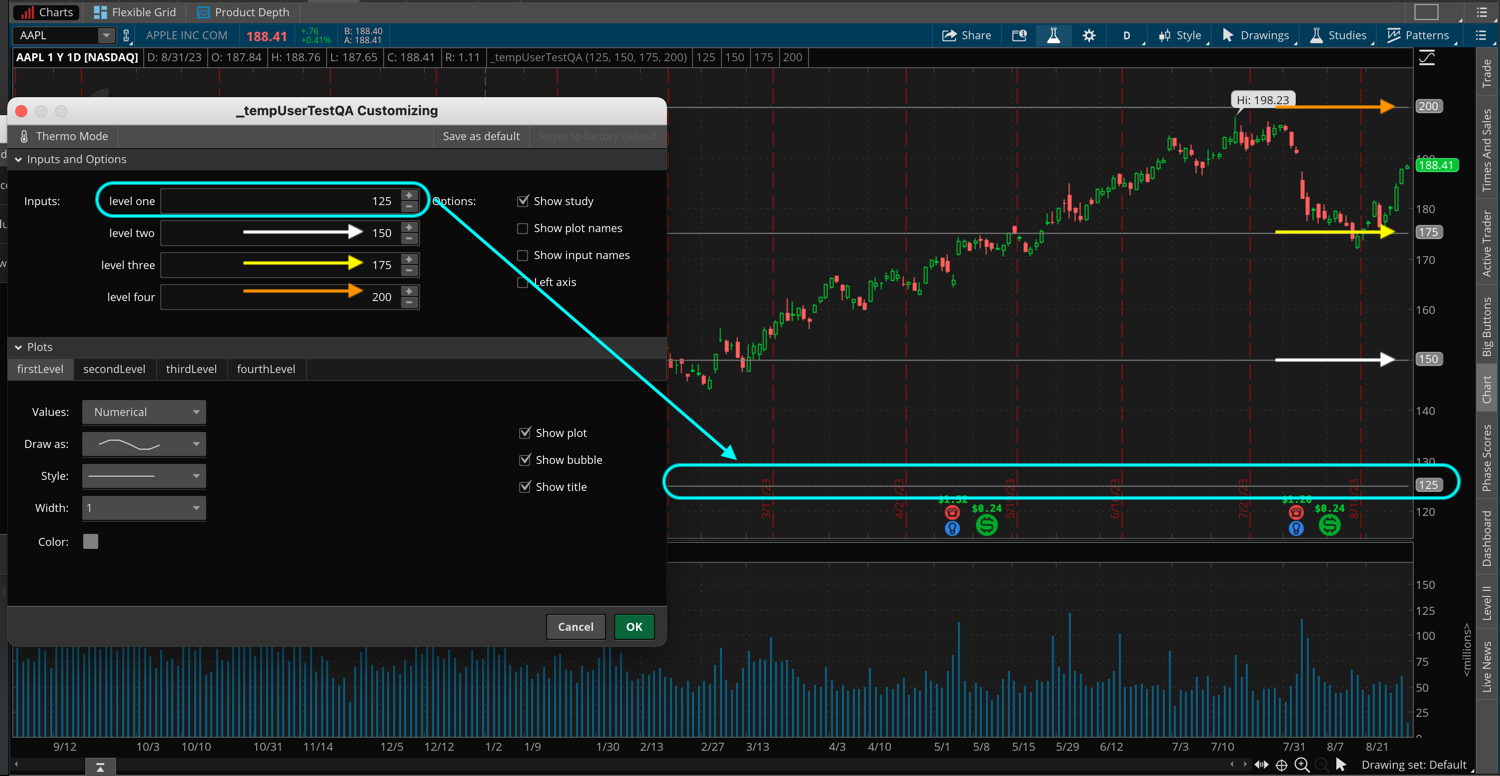
This simplest way to achieve this is to adjust the chart settings. First two screenshots below show how to adjust the setting named "Custom Interval", located within the "Price axis" section of the chart settings. I have included two examples in the screenshots below. One for an interval of 25 and another for the interval of 50. If you did not know this setting was available, be sure to check out Part Two of our master class on chart settings: https://www.hahn-tech.com/thinkorswim-chart-settings-tutorial/ Another very simple method is to create a custom chart study which plots the levels based on your own user inputs. The following section of code plots four different lines which you manually enter in the user input for each level:
Yes, it is possible to create a more complex chart study which is able to automatically adjust those levels based on current price. But the complexity of that solution is way beyond the scope of solutions I can provide free of charge in the Q&A Forum. Attachments:
Marked as spam
Answered on August 31, 2023 8:38 am
|