| ♥ 0 |
Hi Pete. I came across a previous post in which you created a watchlist column which shows the current percent change from opening bell. Is there a way to create a scan that shows stocks with the overall highest percentage gain since open as well as second scan that shows the highest percentage loss since open? Below I have provided the link to the previous post and script. Thank you. https://www.hahn-tech.com/ans/calculate-percent-change-from-opening-bell-to-current-close/
Marked as spam
|
|
Private answer
Since your request is for a custom scan, I moved your question out of the "Frequently Asked Questions" topic and into the "Stock Scanners" topic. Your question includes a bit of a curve ball which requires me to go into a bit more detail than the average solution in this Q&A Forum. The vast majority of custom scans return a list of stocks which meet a specific criteria. In this case, there would need to be a Boolean statement which evaluates to true/false. But you have requested a list of stocks ranked according to their percent change since open. Which requires us to apply a technique to this scan which is not commonly understood. I will do my best to describe this briefly, without leaving out any important details. Step 1: Add the code from that previous post to a custom watchlist column, set the time frame to daily, and save it. Step 2: Add a study filter to a new custom scan and apply the following code to that study filter, (also set to daily time frame):
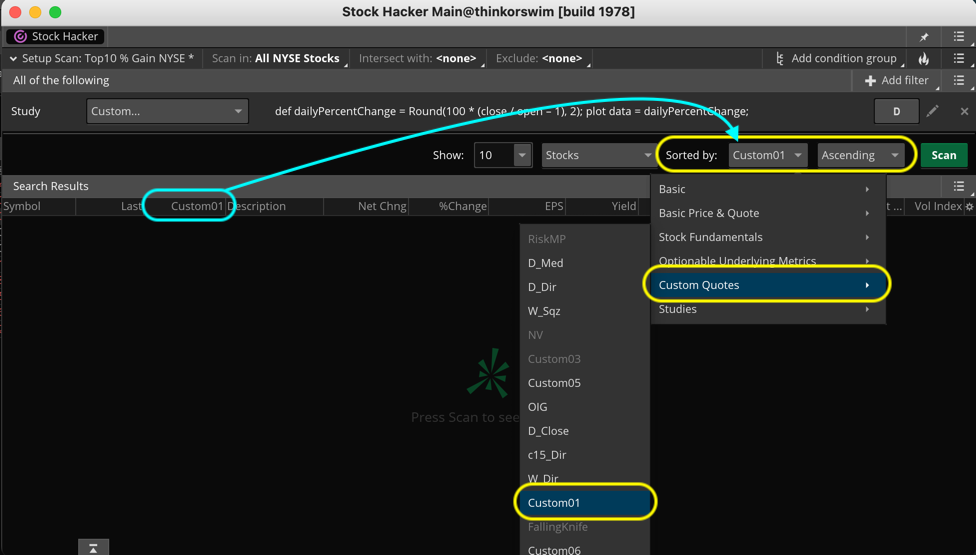
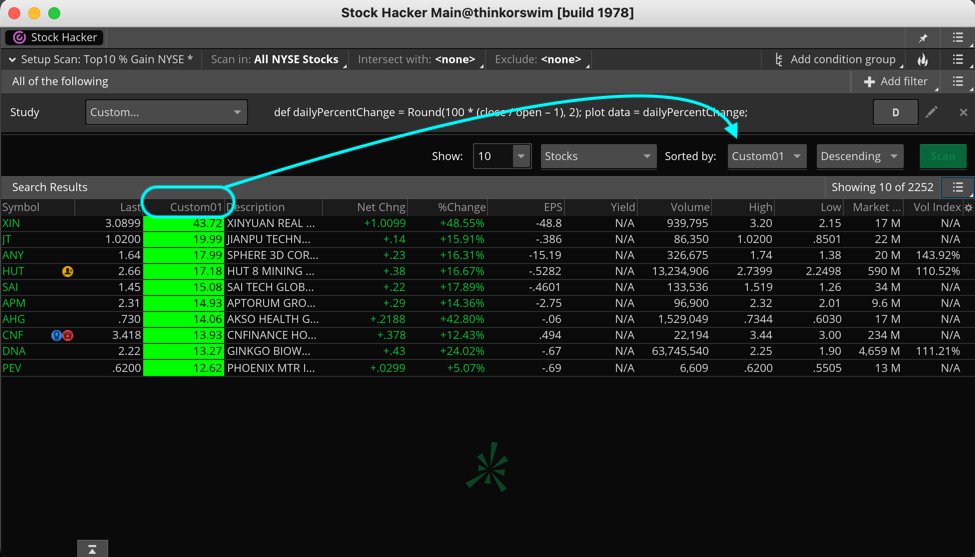
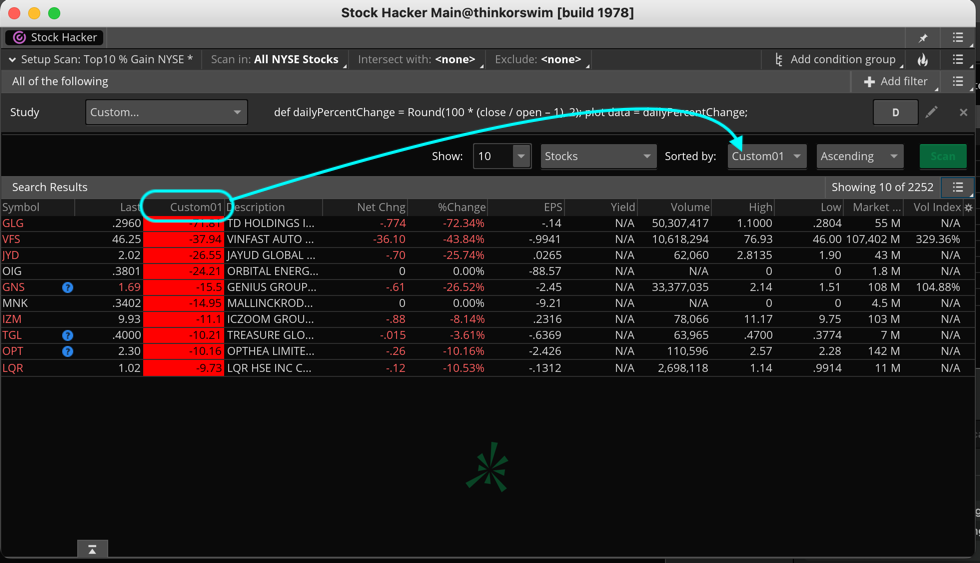
Step 3: And here is where we run off the common path so pay close attention. The screenshot below shows how to assign that custom column as the "Sorted by:" parameter of the custom scan. This is the element which will cause the scan to return a list of stocks with either: 1. The largest percentage gain since open OR 2. The largest percentage loss since open Step 4: How do we select between those to options? But adjusting the parameter immediately to the right of the "Sorted by:". You select "Descending" for option 1 and you select "Ascending" for option 2. I have included two additional screenshots showing both of these options. Notice there is another parameter named "Show:". This tells the scan how many stocks to return in the results list. So how did I learn how all of this works? I simply examined one of the built-in scans included with Thinkorswim, which are listed in the "Top 10" category. So you can experiment on your own to see how the developers of Thinkorswim have created those built-in scans. And once you understand how they are constructed, you will gain a new skill in building custom scans. Attachments:
Marked as spam
Answered on August 29, 2023 1:31 pm
|