Pre-Market HL & Previous Day’s HLC


Category:
0
0

Hi Pete, could you please try adding the previous day’s HLC to the code below with the same formatting? Thank you

***************************************************

declare hide_on_daily;
input PlotOverNightExtremes = yes;
input DisplayPriceBubbleOnHiLowBar = yes;
input DisplayPriceBubbleOnRightEdge = yes;

def o = open;
def h = high;
def l = low;
def c = close;
def v = volume;
def bar = BarNumber();
def GDF = GetTime() < RegularTradingStart(GetYYYYMMDD());

def vol = if GDF and !GDF[1]
then v
else if GDF
then vol[1] + v
else Double.NaN;

def GDF_Volume = vol;

def ONhigh = if GDF and !GDF[1]
then h
else if GDF and
h > ONhigh[1]
then h
else ONhigh[1];

def ONhighBar = if GDF and h == ONhigh
then bar
else Double.NaN;

def ONlow = if GDF and !GDF[1]
then l
else if GDF and
l < ONlow[1]
then l
else ONlow[1];

def ONlowBar = if GDF and l == ONlow
then bar
else Double.NaN;

def OverNightHigh = if BarNumber() == HighestAll(ONhighBar)
then ONhigh
else OverNightHigh[1];

def OverNightLow = if BarNumber() == HighestAll(ONlowBar)
then ONlow
else OverNightLow[1];

#
plot ONH = if OverNightHigh > 0
then OverNightHigh
else Double.NaN;

ONH.SetHiding(!PlotOverNightExtremes);
ONH.SetPaintingStrategy(PaintingStrategy.SQUARES);
ONH.SetDefaultColor(Color.BLUE);
ONH.HideBubble();
ONH.HideTitle();

#
plot ONL = if OverNightLow > 0
then OverNightLow
else Double.NaN;

ONL.SetHiding(!PlotOverNightExtremes);
ONL.SetPaintingStrategy(PaintingStrategy.SQUARES);
ONL.SetDefaultColor(Color.LIGHT_GRAY);
ONL.HideBubble();
ONL.HideTitle();

# Bubble code
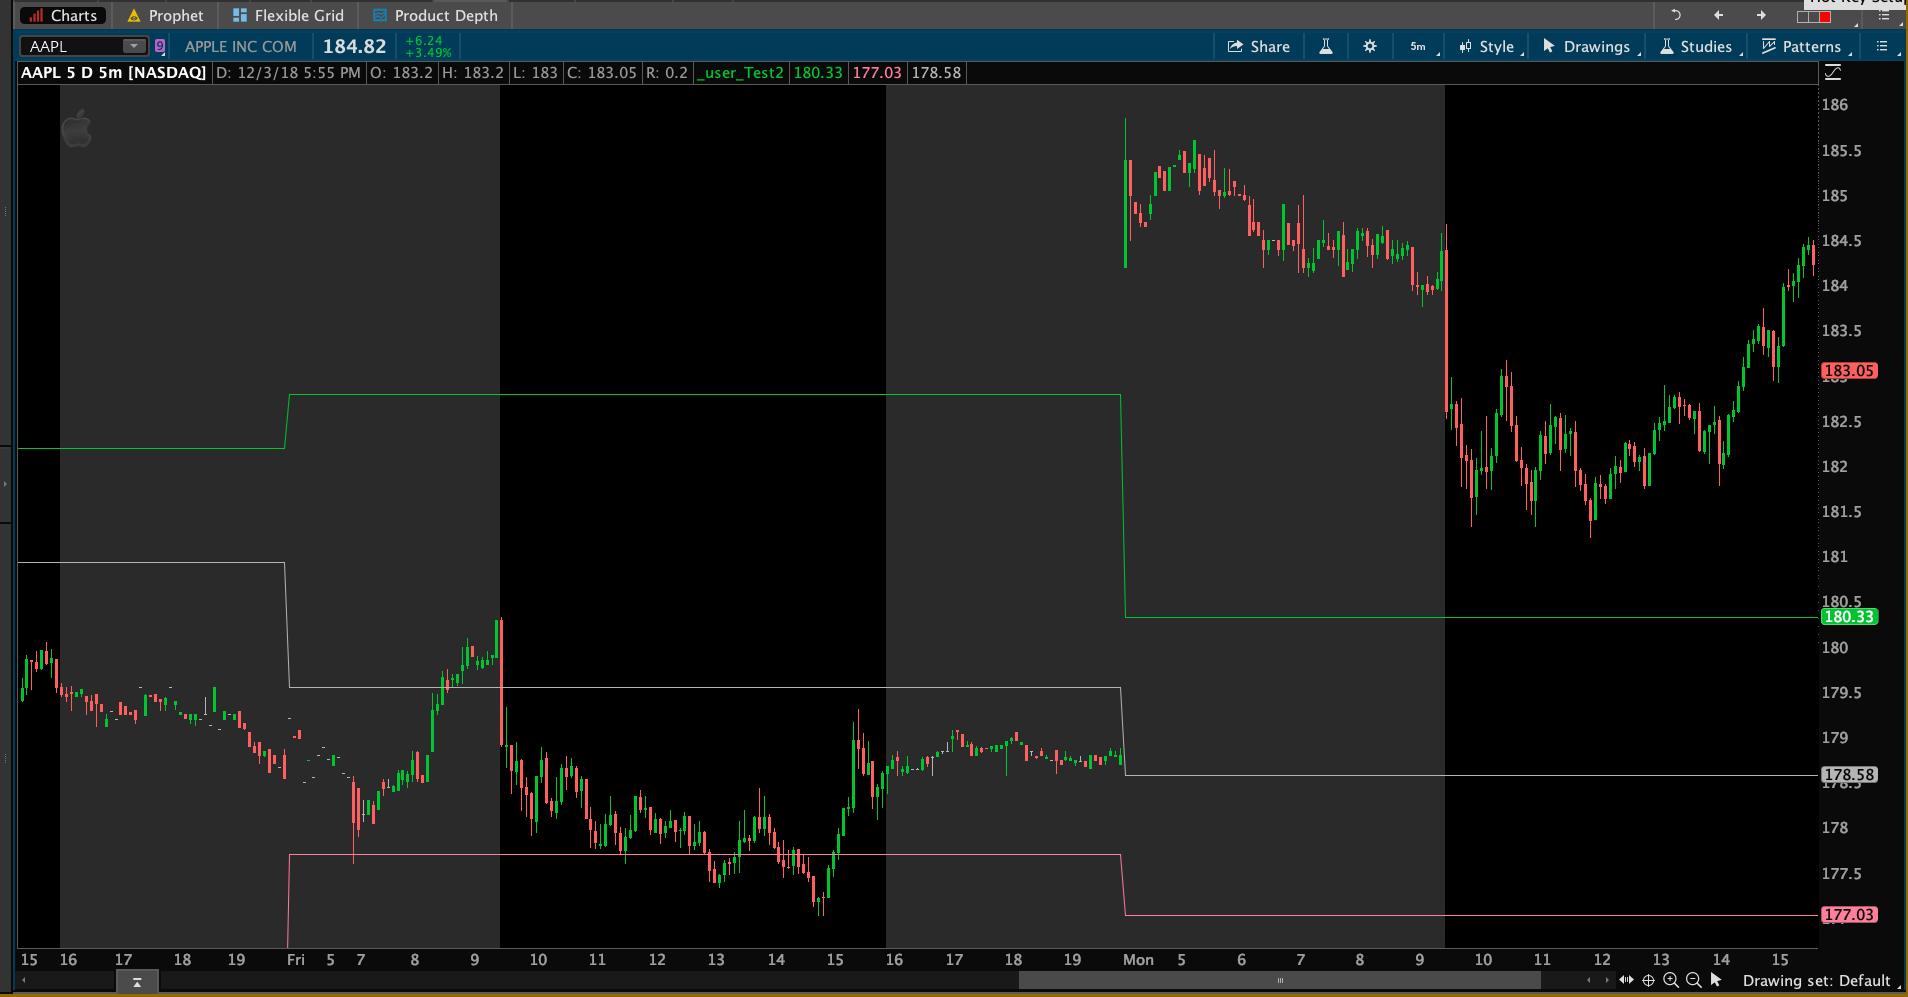
AddChartBubble(bar == ONhighBar and PlotOverNightExtremes and DisplayPriceBubbleOnHiLowBar, ONH, “ONH: ” + ONH, createColor(204,204,255));
AddChartBubble(bar == ONlowBar and PlotOverNightExtremes and DisplayPriceBubbleOnHiLowBar, ONL, “ONL: ” + ONL, createColor(204,204,255),no); #designated that the bubble be painted below the ONL line. 2018-04-07 JQ

AddChartBubble(barNumber() == highestAll(barnumber()) and PlotOverNightExtremes and DisplayPriceBubbleOnRightEdge, ONH, “ONH: ” + ONH, createColor(204,204,255));
AddChartBubble(barNumber() == highestAll(barnumber()) and PlotOverNightExtremes and DisplayPriceBubbleOnRightEdge, ONL, “ONL: ” + ONL, createColor(204,204,255),no);

RESOLVED
Marked as spam
Posted by (Questions: 5, Answers: 6)
Asked on November 29, 2018 12:35 pm
566 views
0

So when you say “HLC” do you mean (high + low + close) / 3?

Does that computation need to include premarket hours trade or only regular session trade?

( at November 30, 2018 7:26 am)
0

Thanks for your response, Pete. Sorry for the lack of clarity. I meant the previous day’s High, Low and Close price levels to be plotted separately at the level extremes like the code to pre-market above shows.

Thank you for your help.

( at December 1, 2018 4:50 pm)
0

Ok, daily high, low and close. Still need to know….”to include premarket hours trade or only regular session trade”

( at December 1, 2018 8:04 pm)
0

Sorry, with pre-market hours. Much appreciated!

( at December 3, 2018 2:21 pm)
0
Private answer

After getting clarification we can provide a solution. This is how I would do it. Very low tech and non-fancy. You can incorporate this into your own code and handle the styling if you want to clean it up. Screenshot below shows the result.

def newDay = GetDay() <> GetDay()[1];
rec dailyHigh = if newDay then high else if high > dailyHigh[1] then high else dailyHigh[1];
rec dailyLow = if newDay then low else if low > 0 and low < dailyLow[1] then low else dailyLow[1];
def previousClose = close(period = AggregationPeriod.DAY)[1];
rec previousHigh = if newDay then dailyHigh[1] else previousHigh[1];
rec previousLow = if newDay then dailyLow[1] else previousLow[1];
plot priorDayHigh = previousHigh;
plot priorDayLow = previousLow;
plot priorDayClose = previousClose;


Attachments:
Marked as spam
Posted by (Questions: 37, Answers: 4079)
Answered on December 3, 2018 4:02 pm
0

Many thanks Pete. Just a couple of things. I actually should have said regular hours as I wanted the daily candle actual (sorry) and only show one day rollback (i.e. the very last trading day). As for formatting, I tried making the level extend to the to the top/bottom of the actual candle like the code above has to pre-market to no avail.
Thank you again for your help as always.

( at December 3, 2018 4:54 pm)
0

The daily candle is so much easier to plot than trying to include the premarket high/low.

plot previousDayHigh = high(period = AggregationPeriod.DAY)[1];
plot previousDayLow = low(period = AggregationPeriod.DAY)[1];
plot previousDayClose = close(period = AggregationPeriod.DAY)[1];

To plot only for the last day on the chart we add a filter.

def okToPlot = GetDay() == GetLastDay();

And we apply that filter to our three lines of code like this.

plot previousDayHigh = if okToPlot then high(period = AggregationPeriod.DAY)[1] else Double.NaN;
plot previousDayLow = if okToPlot then low(period = AggregationPeriod.DAY)[1] else Double.NaN;
plot previousDayClose = if okToPlot then close(period = AggregationPeriod.DAY)[1] else Double.NaN;

( at December 4, 2018 7:52 am)
0
Thank you Pete. One last question/request, how can i make the lines extend left to where the price point occurred? I’ve attached an image file to ’answer’ to demonstrate what I mean as I could not attach it here. I just wanted to keep consistent with the PM code which is easier on my eyes. Thank you again.
( at December 4, 2018 11:22 am)
0

Not sure what this “price point” is. But to extend these lines left you have only one option. You can extend them across the entire viewable area of the chart. That’s it. Since they are pulling from the daily time frame they will only have a left-hand start point of the first intraday bar of the regular trading session. You can have them begin at any other location.

( at December 4, 2018 12:29 pm)
0
I have the original indicator at the top and it also shows up on mobile. The second code does not show up correctly on mobile at all. I found another post with the previous days high low and close as well and it’s not the same on mobile either. Anyone know why and how to fix it?
( at May 2, 2023 6:53 pm)
0
These types of indicators are not supported on the mobile app. If you want to know the technical reason I will provide the details: 1. Secondary aggregation periods are not supported on the mobile app 2. Recursive variables are not supported on the mobile app. At this time there are no workarounds available.
( at May 2, 2023 10:15 pm)