| ♥ 0 |
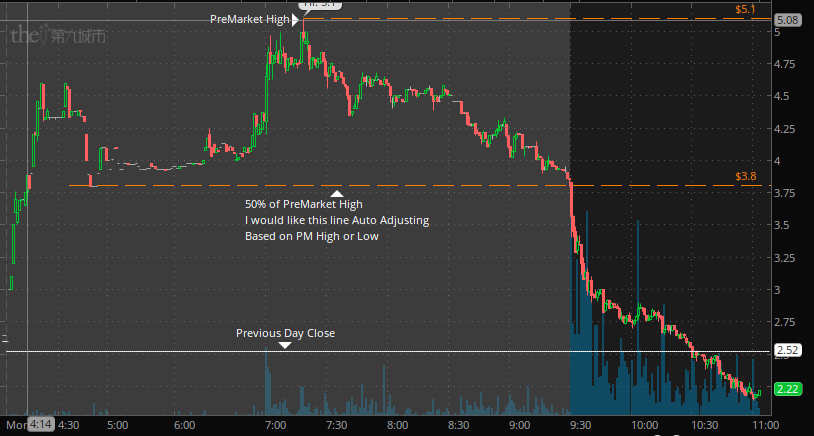
Hi, I’m looking for a Premarket only indicator that will plot a 50% line between the Previous Day Close and Premarket High or Low. I’m thinking like AutoFibonacci indicator, but only plots the 50% line only during Premarket. Thanks very much for any assistance! Attachments:
Marked as spam
Asked on April 19, 2019 6:57 am
244 views
|
|
Private answer
For this solution we are going to barrow some code provided in a previous request: https://www.hahn-tech.com/ans/premarket-study-on-chart/ That previous post links back to another so be sure to follow the links to get the full context. The original post you find will be a request for a premarket High/Low label. This code gives us all the structure we need to add in the 50% line. Be sure to read those previous posts so that you understand how to use this code:
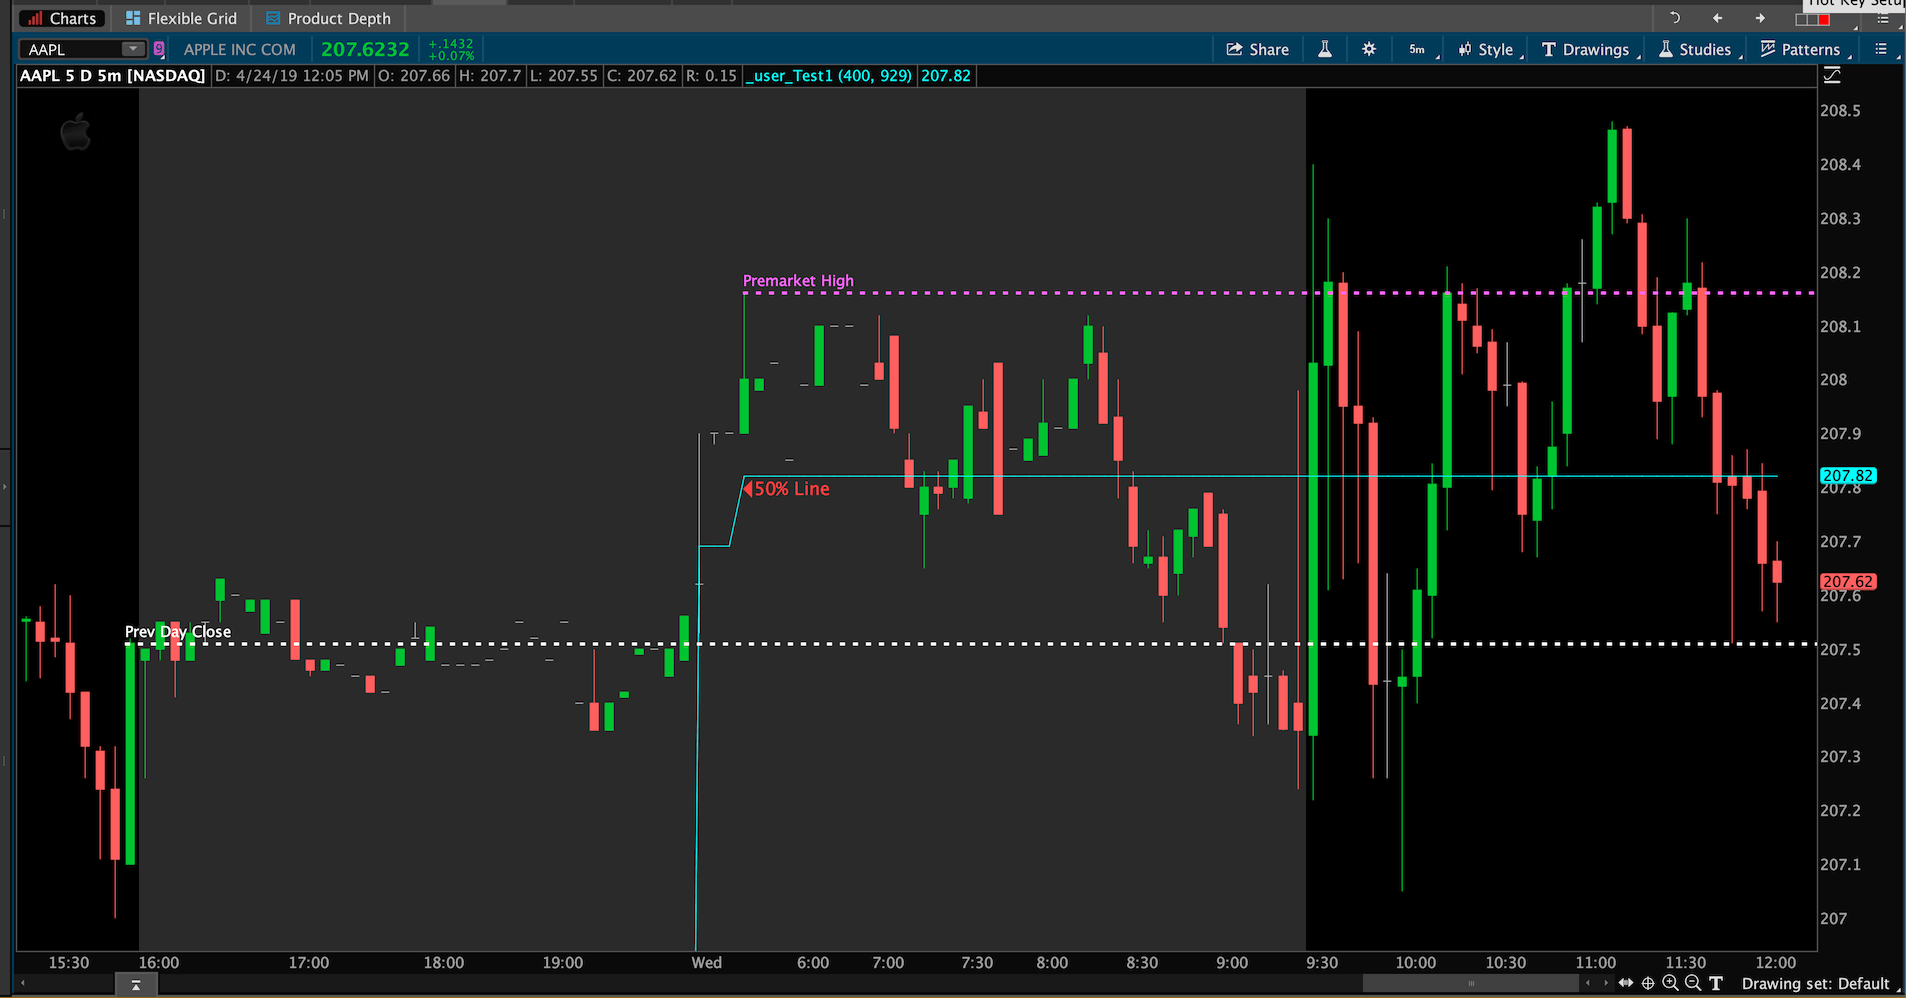
Screenshot below shows the result. Note that the previous day close and premarket high lines have been drawn on the chart by hand. This code only plots the 50% line. Attachments:
Marked as spam
Answered on April 29, 2019 12:08 pm
|
I need to clarify this statement: “but only plots the 50% line only during Premarket.”
So did you only want the line to plot for the duration of the premarket period, and not plot during the regular session period? Or did you want this level plotted for both sessions?
Hey Pete,
I only want PreMarket 50% line. Thanks very much!
Please answer the question. The question is where do you want this plot to show up on the chart. Do you want it to show up for the entire chart or only for the premarket portion of the chart?
apologies… the entire chart. looking just like the image i attached to the original post