| ♥ 0 |
I knows this have been covered in different posts, and i apologize in advance for any inconvincente this might cause, but i dont fully understand something: Regard the suggested code, why is not possible use the 1m time frame to get more accurate closing from previos day, like value from 1600; ive tried this modification and unfortunately didnt work. Another possible solution could be use the current build watchlist like: mark % change – % change ? Thanks! (and sorry)
RESOLVED
Marked as spam
|
|
Private answer
I updated the title of your question to make sure the question I think you are asking was more clearly expressed. This will help other viewers who may have this same question to locate it using the search function. Notice the very first line of the code in that solution you referenced:
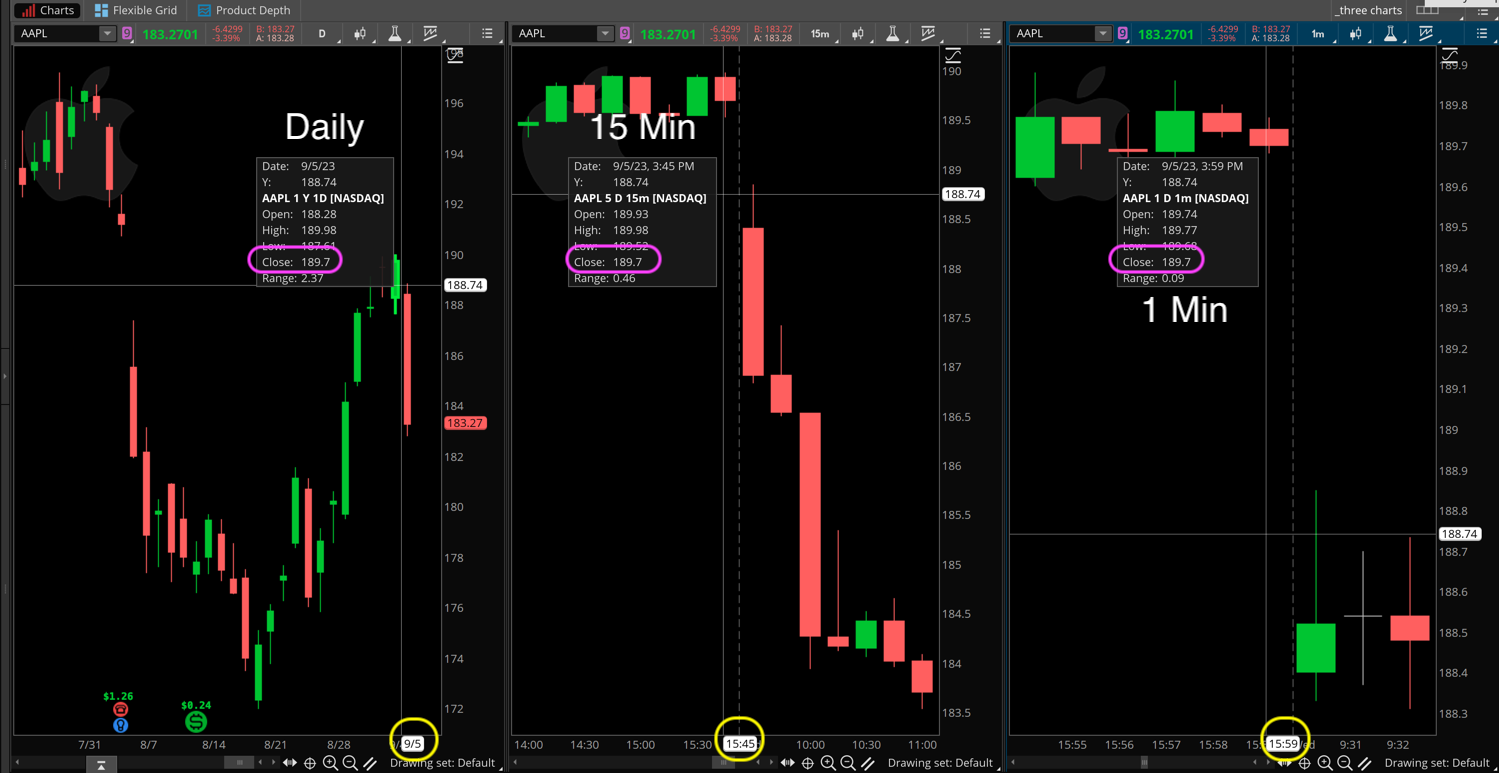
Just change the time to 1559, then set the time frame to 1 min. On Thinkorswim each bar is stamped with the time that each bar opens. So the last bar of the regular session the 1 minute time frame is 1559 (NOT 1600). You can read the time stamp on any bar of the chart by hovering your mouse of each bar. The watchlist columns, study filters, study alerts and conditional orders are all set to Eastern time zone, regardless what you have your charts set to. So keep that in mind and make sure to apply whatever conversion is appropriate for the time frame you have set on your charts. However you will find that no matter what time frame you select, the closing price of the last bar of the regular session is exactly the same. You can verify this for yourself by examining your charts. Check the closing price of the last bar of the regular session, then change your chart from 1 min, 5 min, 10 min, 15 min..... The same exact value is returned. The lesson from this? The 1 min time frame does not provide a more accurate number than the higher time frames. And if that was tough for you believe, check the daily time frame. Same exact value. (screenshot below demonstrates this) Hope that helps clear things up. And as a side note. Any column you can add to the watchlist gadget that includes the "Mark" price type is not useful for anything. I really wish it was not even included because it causes so much confusion. If you want to read prices that reflect actual trades that have taken place, the correct price type to use is "Close". Always and everywhere. Attachments:
Marked as spam
Answered on September 6, 2023 10:22 am
|