| ♥ 0 |
Mr. Hahn: I am presently using your answer to this idea in my watch list column. Without question it’s a great tool. I find that I still need to check to be sure that the RSI value is climbing or falling. Because these values are constantly moving in real time I would like your opinion on this additional idea. It would be nice to be able to look at this column and also identify if the value is above or below yesterdays close. Would it be possible to change the color scheme on the numbers to reflect, if the present value is greater or less than yesterdays close? Thanks for all you do for us.
Marked as spam
|
|
Private answer
Ok, now that we have some clarification I will provide a solution. The challenge is to present color schemes that clearly express all five conditions and to do so while retaining a high degree of contrast. This is going to vary greatly from one pair of eyes to the next. So what I present here is not going to fit everyone. You will have to make adjustments to adjust for your own perceptual bias. I have provided an updated line from the original post…. (located here) https://www.hahn-tech.com/ans/rsi-custom-watch-list/ And I have provide a new statement that will change the color of the values in the custom watchlist. Once again, to save space I will only be providing the lines that are added to the standard built-in version of the RSI.
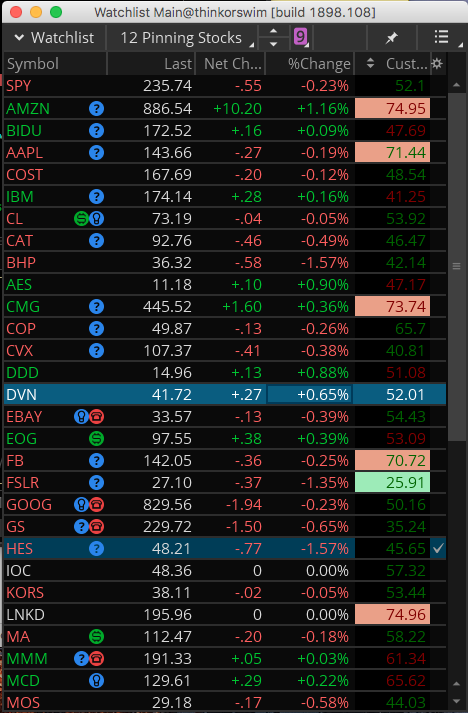
You can see that for the RSI values I am using colors that are built into the thinkscript language. But for the background colors I am using a function named CreateColor(). You can read about that here: http://tlc.thinkorswim.com/center/reference/thinkScript/Functions/Look---Feel/CreateColor.html This function uses RGB values to create a custom color. There are many resources online that allow you to select a custom color from a pallet and retrieve the RGB values used to create it. You can use the CreateColor() function anywhere in the thinkscript language where a standard color is accepted. Screenshot below shows the final result. Attachments:
Marked as spam
Answered on April 1, 2017 12:33 pm
|
|||
|
Private answer
First off, let’s supply the link to that post. Otherwise folks will have a very difficult time finding it and understanding the context of your present request: https://www.hahn-tech.com/ans/rsi-custom-watch-list/ Next, I will update the title of your question to better reflect the request. When other viewers are searching, they will not be searching for a date. They will be searching for something like “Change Watchlist Color Based on Day over Day change of RSI”. To be clear, your request does mention the code in the previous post. And in that post we provide a solution that changes the background color based on the RSI being above or below a specific value. I think you are wanting to keep that functionality and add to it the ability to easily see if the RSI is above or below the previous day’s value. Is this correct? Because in order to provide both, we’ll have to either use for different background colors or we’ll have to change the color of both the text and the background. For instance we could change the background based on the original rules, then change the text color based on your additional criteria. Make sense? So, please provide a bit more details so all these little bits are crystal clear. Then we’ll update this answer to include the statements required to make it happen. Marked as spam
Answered on March 31, 2017 1:22 pm
|
MR Hahn:
Again THANKS for what you are doing. Putting all this chart information in the watch list allows us to see so much more so much faster.
I would like to ask if you ever think about having an open ( members Only ) area on your site where members can ask question about trading and get opinions from other members. I don’t know if there are legal issues to that or not. I think it would be nice if some of your members could share things that work for them as well as things that don’t. Just a thought. I just had pay pal send you something but there was nowhere for a note.
Ed
Thank you very much for your generous contribution. Glad I could help. I love the idea of a members only area where traders can compare notes in a discrete environment. When I added the Q&A forum I had something like this in mind further done the road. We can certainly make it happen. So far you are the first to bring it up, publicly. I think we’ll get there at some point. Thanks again for your contributions to the forum as well as your support.
Is there any way to use the gradient color function within the cell backgrounds? for example the greatest value will be a bright green and the lowest will be a light green?
Short answer. No. Sorry. You have to clearly define each price level as well as it’s associated color. There is no way to define a range and have the color automatically adjust within that range.