| ♥ 0 |
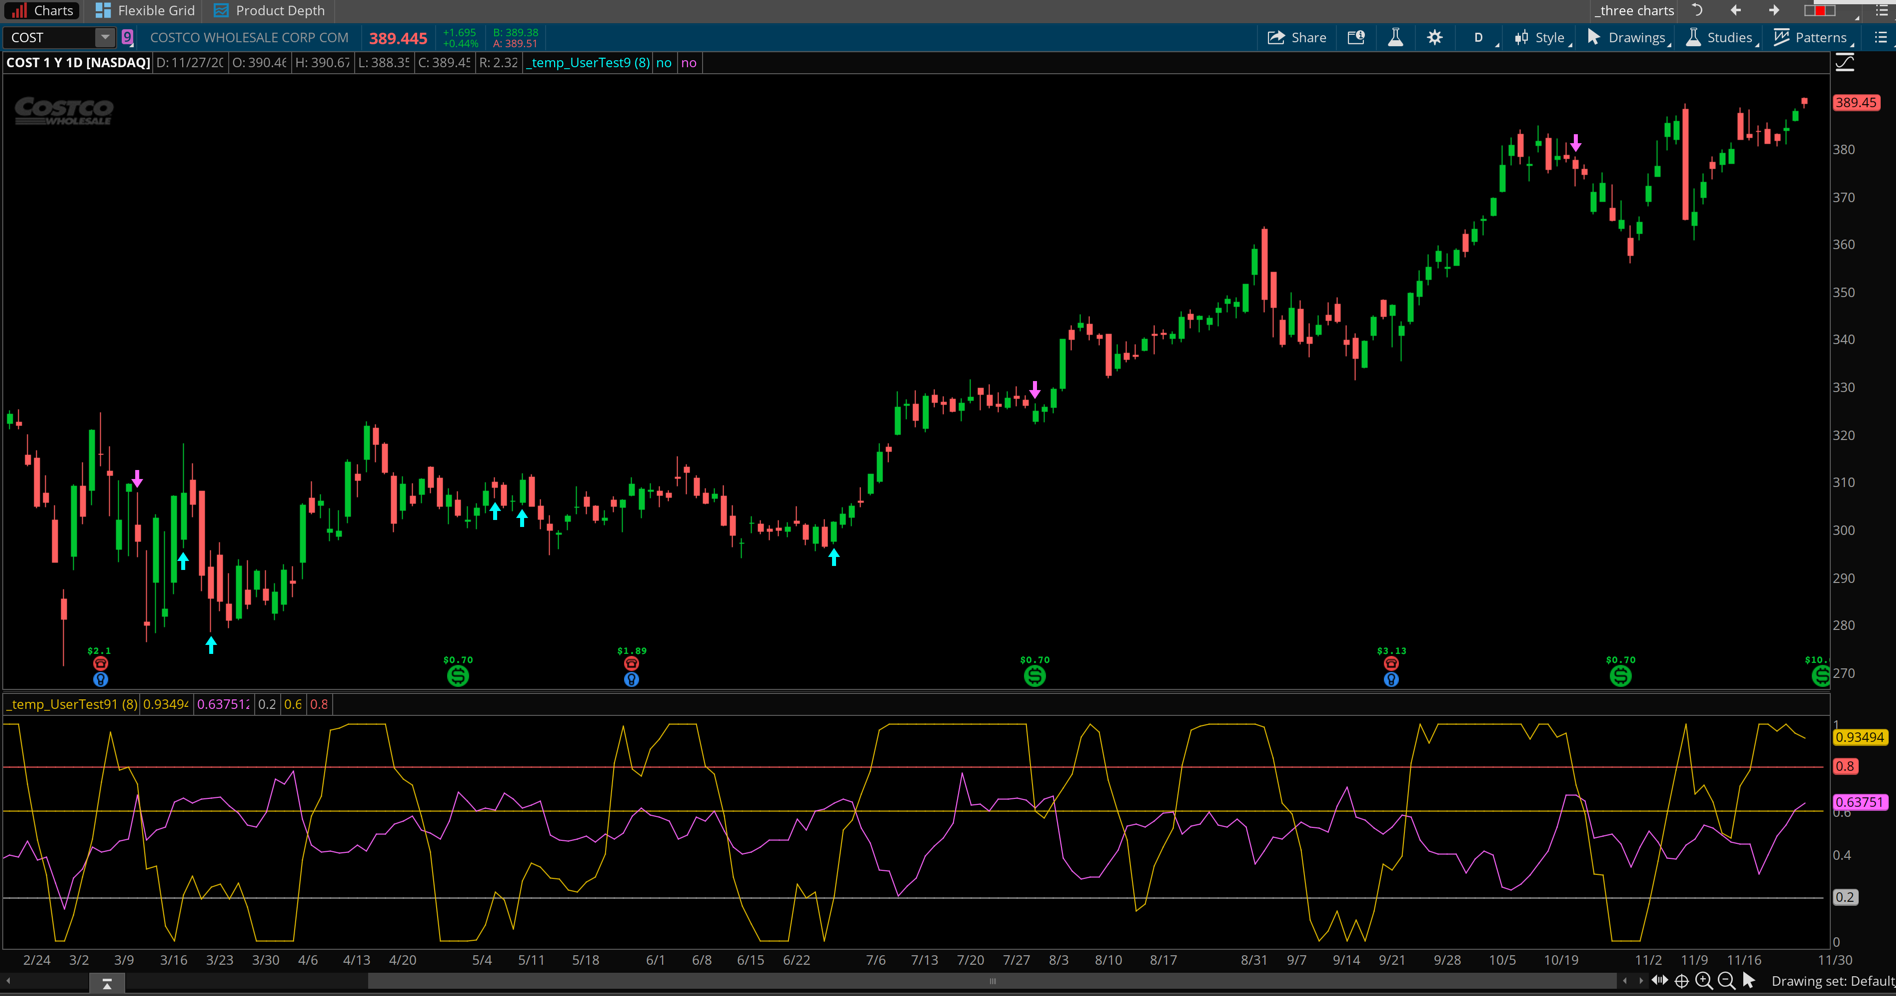
Hello together, I would like to setup a chart study that shows down arrows when RSI Laguerre crosses below 0.8 and gamma > 0.6 and up arrows when RSI Laguerre crosses above 0.2 and gamma > 0.6. I have prepared the code and it does not display any arrows while showing no debugging errors. Any idea what could be the reason that the arrows are not displayed? You find the script in the attachment. Sascha RESOLVED
Marked as spam
Asked on November 27, 2020 12:31 am
1281 views
|