RSI with Heikin Ashi Pivot Indicator


Category:
0
0

Pete,


This is a follow on question to my previous question that in greater detail explains what I am looking to do.


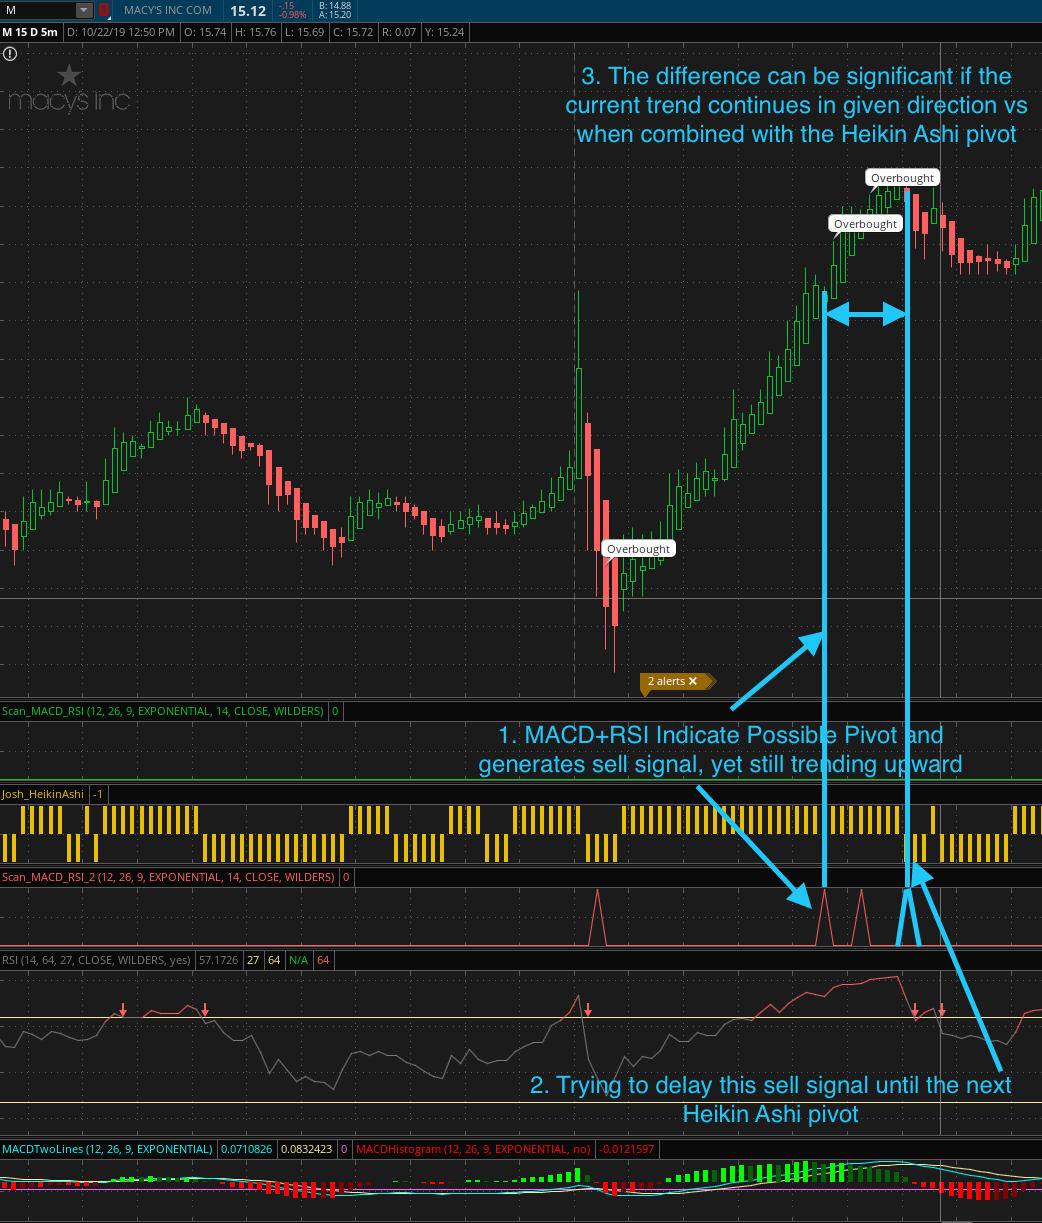
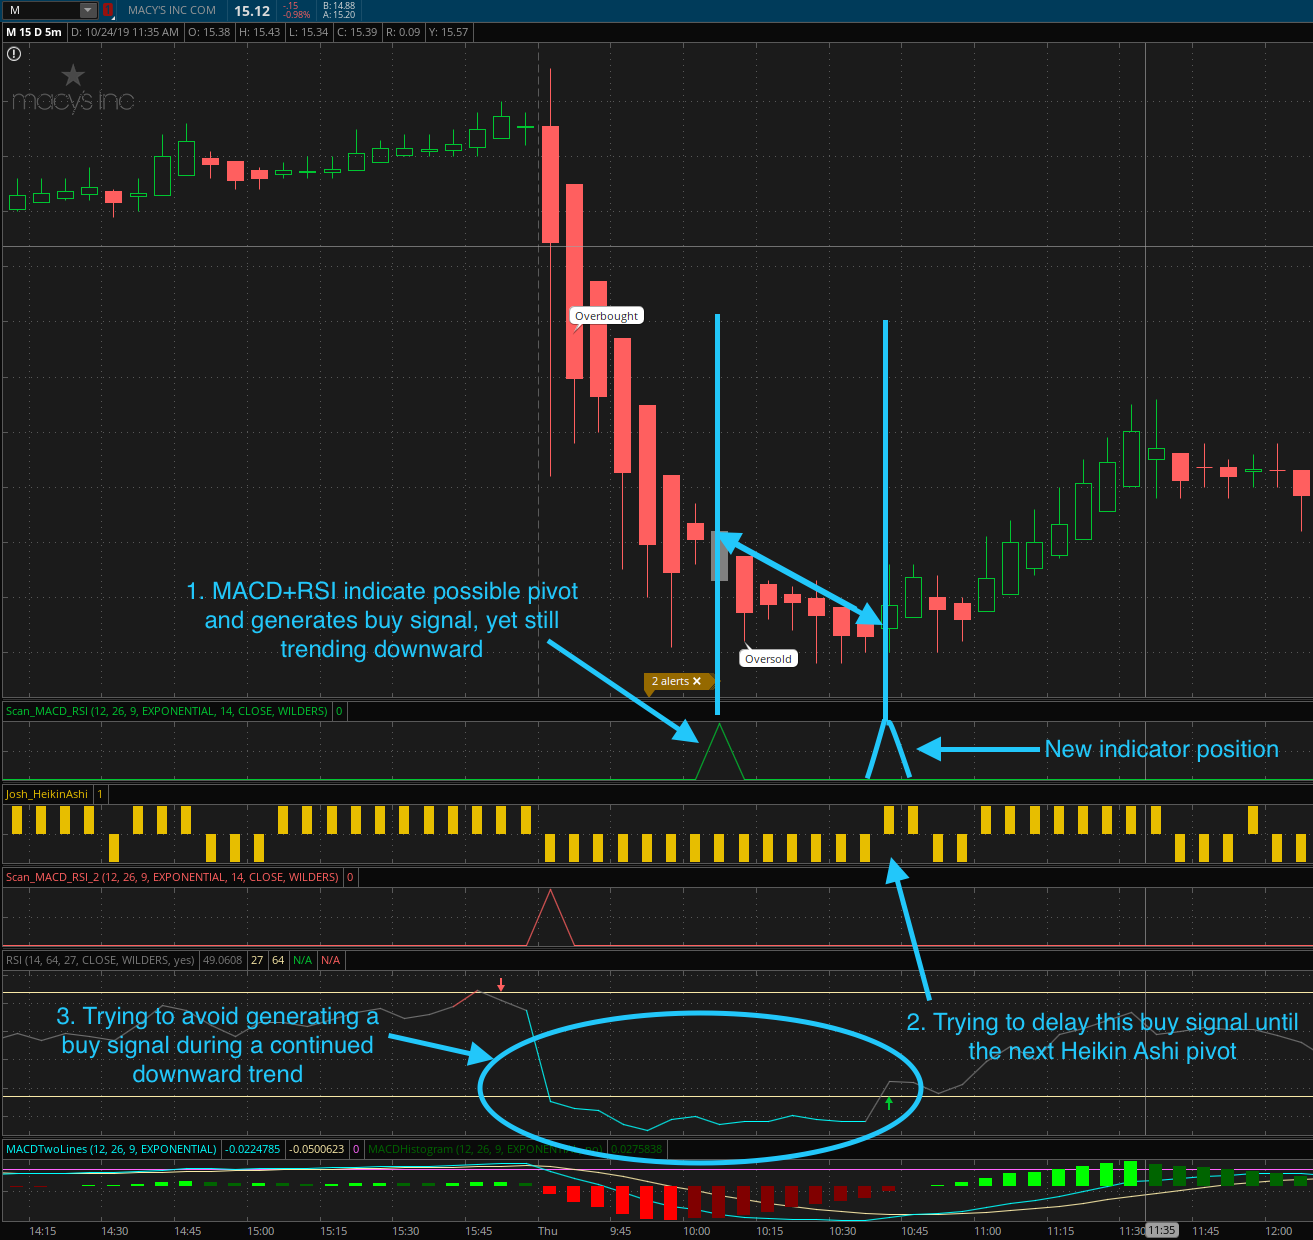
The basis behind the request is to eliminate situations as shown in as shown in the pictures, where while the MACD+RSI would indicate a buy/sell condition but the RSI stays above the oversold/overbought input and continues on it’s upward/downward trend.


My thought would be that instead of plotting the indicator when the MACD histogram pivots while the RSI is oversold/overbought, it would instead make new variable “X” = -1 (oversold) or 1 (overbought) and remain at that value until plotted.


In conjunction, the Heikin Ashi code is always a 1 or -1 based on the current trend. A variable “Trend” in your Heikin Ashi code looks for when “haClose > haOpen then 1 else if haClose < haOpen then -1 else 0”


The indicator would then plot when, for example,  variable”X” = -1 AND Trend = 1, which would signal that the MACD+RSI indicated a possible pivot and the Heikin Ashi trend change confirms it.


After plotting the indicator, the MACD+RSI would return from -1 or 1 to zero until these indicators establish another possible pivot.


I am trying to use the MACD+RSI indicator you developed here:

https://www.hahn-tech.com/thinkorswim-scan-macd-rsi-part-two/


and the Heikin Ashi code you developed here:

https://www.hahn-tech.com/ans/heikin-ashi-on-thinkorswim-mobile-app/


My current effort was able to insert the Heikin Ashi code developed into the MACD+RSI scan, modify it so that instead of plotting the “trend”, turn it into a variable to be used with the plot MACD+RSI plot.  This works, however will only plot the buy/sell indicator if the Heikin Ashi trend change occurs at the time of the MACD+RSI condition, but does not capture the situations where the equity continues to be oversold/overbought RSI zone and remain on its trend as described above.


Code for this is below:

<pre>

input fastLength = 12;
input slowLength = 26;
input MACDLength = 9;
input averageTypeMACD = AverageType.EXPONENTIAL;

def Diff = MACD(fastLength, slowLength, MACDLength, averageTypeMACD).Diff;

input length = 14;
input price = close;
input averageType = AverageType.WILDERS;

def NetChgAvg = MovingAverage(averageType, price – price[1], length);
def TotChgAvg = MovingAverage(averageType, AbsValue(price – price[1]), length);
def ChgRatio = if TotChgAvg != 0 then NetChgAvg / TotChgAvg else 0;

def RSI = 50 * (ChgRatio + 1);

def pivotLowMACD = Diff > Diff[1] and Diff[1] > Diff[2] and Diff[2] < Diff[3] and Diff[3] < Diff [4];

def pivotHighMACD = Diff < Diff[1] and Diff[1] < Diff[2] and Diff[2] > Diff[3] and Diff[3] > Diff[4];

def oversoldRSI = RSI <= 27;
def overboughtRSI = RSI >= 64;

def haClose = ohlc4;
def haOpen = if haOpen[1] == 0 then haClose[1] else (haOpen[1] + haClose[1]) / 2;
def haHigh = Max(high, Max(haClose, haOpen));
def haLow = Min(low, Min(haClose, haOpen));
def trend = if haClose > haOpen then 1 else if haClose < haOpen then -1 else 0;

plot scan = pivotHighMACD and trend <= 0 and Highest(overboughtRSI[1], 4) > 0;

</pre>

Attachments:
Marked as spam
Posted by (Questions: 3, Answers: 5)
Asked on October 30, 2019 6:02 pm
661 views
0
Private answer

After reviewing the signals you marked in your screenshots I determined that the MACD component is blocking the signals you are trying to pick up. So I updated the code to remove the MACD and correct many other items that were preventing your desired signal from being picked up correctly.

input length = 14;
input price = close;
input averageType = AverageType.WILDERS;
input overBought = 64;
input overSold = 27;
input barAgoRSI = 4;
def netChgAvg = MovingAverage(averageType, price – price[1], length);
def totChgAvg = MovingAverage(averageType, AbsValue(price – price[1]), length);
def chgRatio = if totChgAvg != 0 then netChgAvg / totChgAvg else 0;
def rsi = 50 * (chgRatio + 1);
def rsiConditionOS = rsi <= overSold; def rsiConditionOB = rsi >= overBought;
def haClose = ohlc4;
def haOpen = if haOpen[1] == 0 then haClose[1] else (haOpen[1] + haClose[1]) / 2;
def haHigh = Max(high, Max(haClose, haOpen));
def haLow = Min(low, Min(haClose, haOpen));
def trend = if haClose > haOpen then 1 else if haClose < haOpen then -1 else 0;
# scan for RSI having been overbought within x bars and HA pivot bearish
plot scan = trend[1] <> -1 and trend == -1 and Highest(rsiConditionOB[1], barAgoRSI) > 0 and rsi < overBought;
# scan for RSI having been oversold within x bars and HA pivot bullish
#plot scan = trend[1] <> 1 and trend == 1 and Highest(rsiConditionOS[1], barAgoRSI) > 0 and rsi > overSold;

Screenshot below shows both signals plotted on the lower subgraph.

Attachments:
Marked as spam
Posted by (Questions: 37, Answers: 4091)
Answered on November 1, 2019 12:06 pm
0
Pete, thanks for the help! This is pretty much what I was looking for, made some small tweaks but looking pretty good. I still think the MACD is an important precursor to the HA pivot indicator, and wish I knew how to implement it like described above. Something similar to how you did the barAgoRSI. Such that the plot would be: plot scan = trend[1] -1 and trend == -1 and ”MACD+RSI trigger occurred within X bars ago”. But I think what I have is close enough for now, if you feel that this ”MACD+RSI occur within x bars” would be simple and could offer any suggestion it would be great, but if not dont worry about it. Appreciate all your videos! The last thing, is that with this new code I cannot seem to create a study alert due to an ”rec usage is not allowed in this context” error. I decided to create a custom scan alert based on your video here: https://www.hahn-tech.com/ans/set-alerts-for-custom-indicators/ and hopefully this will still provide the alerts that I need to my mobile device/email.
( at November 3, 2019 7:24 am)
0
We are right on the border for the time and complexity I permit for solutions provided at no charge in the Q&A forum. Any further development beyond this will require that you submit a custom project request and pay for a professional solution.
( at November 3, 2019 9:01 am)