Scan for a compression between 2 EMA


Category:
0
0

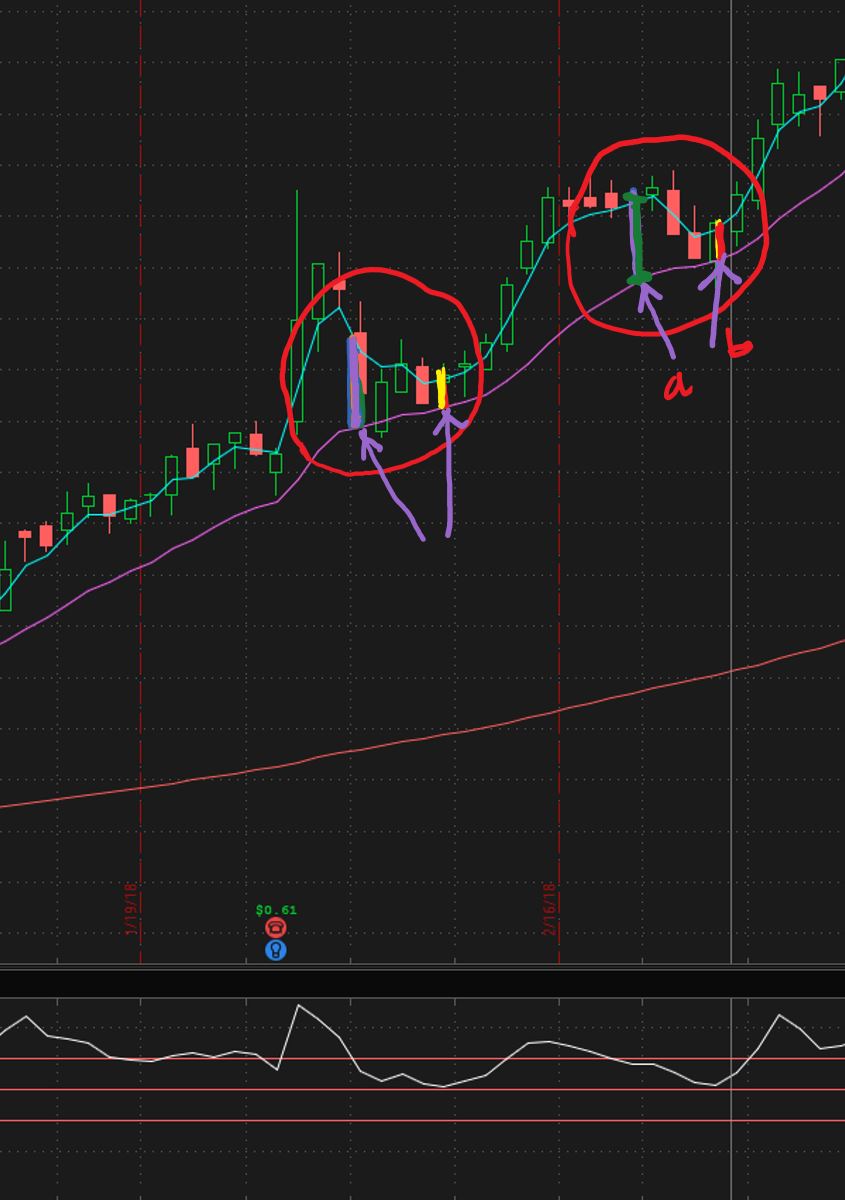
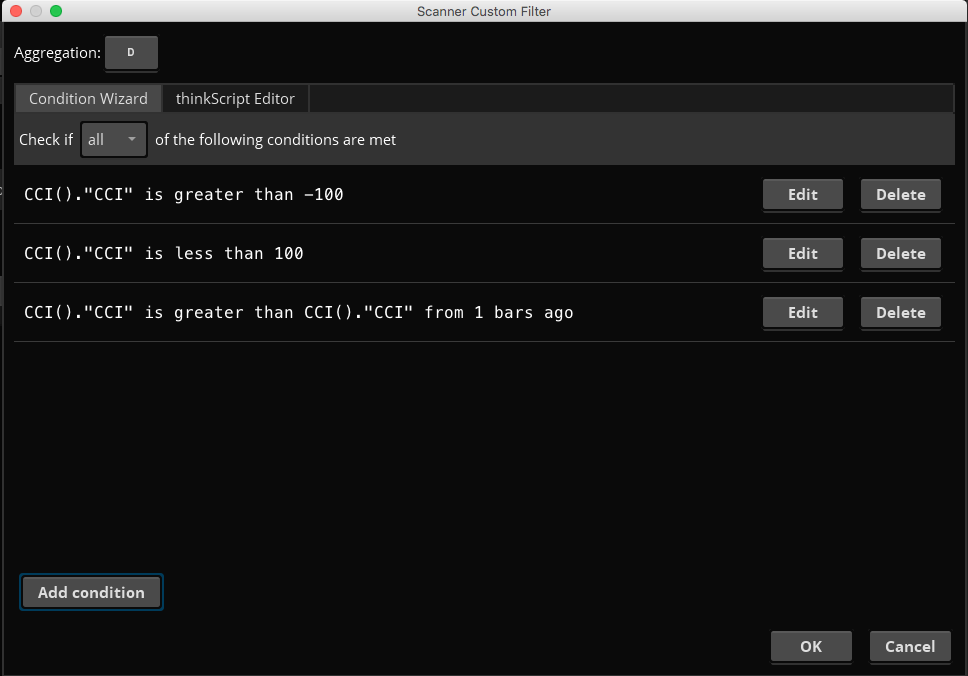
Hello Pete,

Sorry for the double posting. I tried to add the picture in the previous post in the answer box, but I got an error message saying that I need to write something, but I could not do so because I could not click anywhere to write. I re-posted the question here with the clarification you requested. Please feel free to delete either one.

==============================================================================

Hello,

I would like you your assistance please. I am trying to scan for stocks that verify a certain compression using EMA. for example the today’s (ema3-ema15) needs to be less than a certain value (Ratio) than the highest (ema3-ema15) within a certain number of days.  I wrote the code below but the results did not make any sense at all.

def ema3 = ExpAverage(close, 3);
def ema15 = ExpAverage(close, 15);
def compression = (ema3-ema15);
def compression1 = highest(ema3[1]-ema15[1],4);
def signal =(compression1/compression)<3;
plot scan = signal;

Thank you in advance!

=====================================================================

Thank you for your reply. I put a picture in the answer box where I could attach a picture, but could not write a text, so I am writing here as a comment. I meant compression. I want to scan for (a/b)>R, where a=abs(ema3-ema15) and is the highest length within a certain number of bars (N), b=abs(ema3-ema15), and R is a certain ratio(2 for example). abs (is absolute value). Hope is clear. Pete, Please could you add to that scan a code that checks for CCI(default) being between -100 and 100 but going upwards. Thank you!

Attachments:
Marked as spam
Posted by (Questions: 6, Answers: 8)
Asked on March 12, 2018 12:13 pm
156 views
0
Private answer

Your screenshot does not include the entire chart. So it is not possible to see the ticker symbol and time frame used. Which means I cannot replicate that chart on my side. Which limits my effectiveness in answering your question. I don’t understand why, but most people seem to think that they need to  provide the smallest screenshot possible. I mention it, so that we can start changing people’s behavior.

So, I see you have some code and you claim it is not working. However it does work. Have you tried plotting it on a chart? I works in reverse. It is evaluating true until the ratio dips below 3, at which time it switches to false. It’s just backwards.

And I can easily add the Absolute Value that you requested. Here is what that looks like (along with a few more tweaks you will appreciate):

def ema3 = ExpAverage(close, 3);
def ema15 = ExpAverage(close, 15);
def compression = AbsValue(ema3 - ema15);
def compression1 = Highest(compression[1], 4);
def signal = (compression1 / compression) < 3;
plot scan = signal;

You only need to change the signal from less than 3 to greater than 3. Or change the way the ratio is computed.

But there is another issue. Your screenshot clearly shows that you want to pick up pullbacks within a trend. However this code is agnostic to trend. Which means it will generate signals when the two moving averages cross. Because that is when the distance between them is the smallest. So if you don’t want to pick up crosses you will need to add some lines of code to filter those out.

For your request to add a filter for the CCI. Screenshot attached shows how to set this up using the condition wizard. No code writing required.

Attachments:
Marked as spam
Posted by (Questions: 37, Answers: 4090)
Answered on March 12, 2018 1:30 pm