Scan for bar color over many time frames


Category:
0
0

Pete

I have a study that colors my bars red/green and yellow for neutral…I was looking  to scan for stock that are all red or green in multiple time frames…I would only get results if the 5,10,15,20,30,1hr.2hr,4hr and daily are all geeen. Or a variation of that…


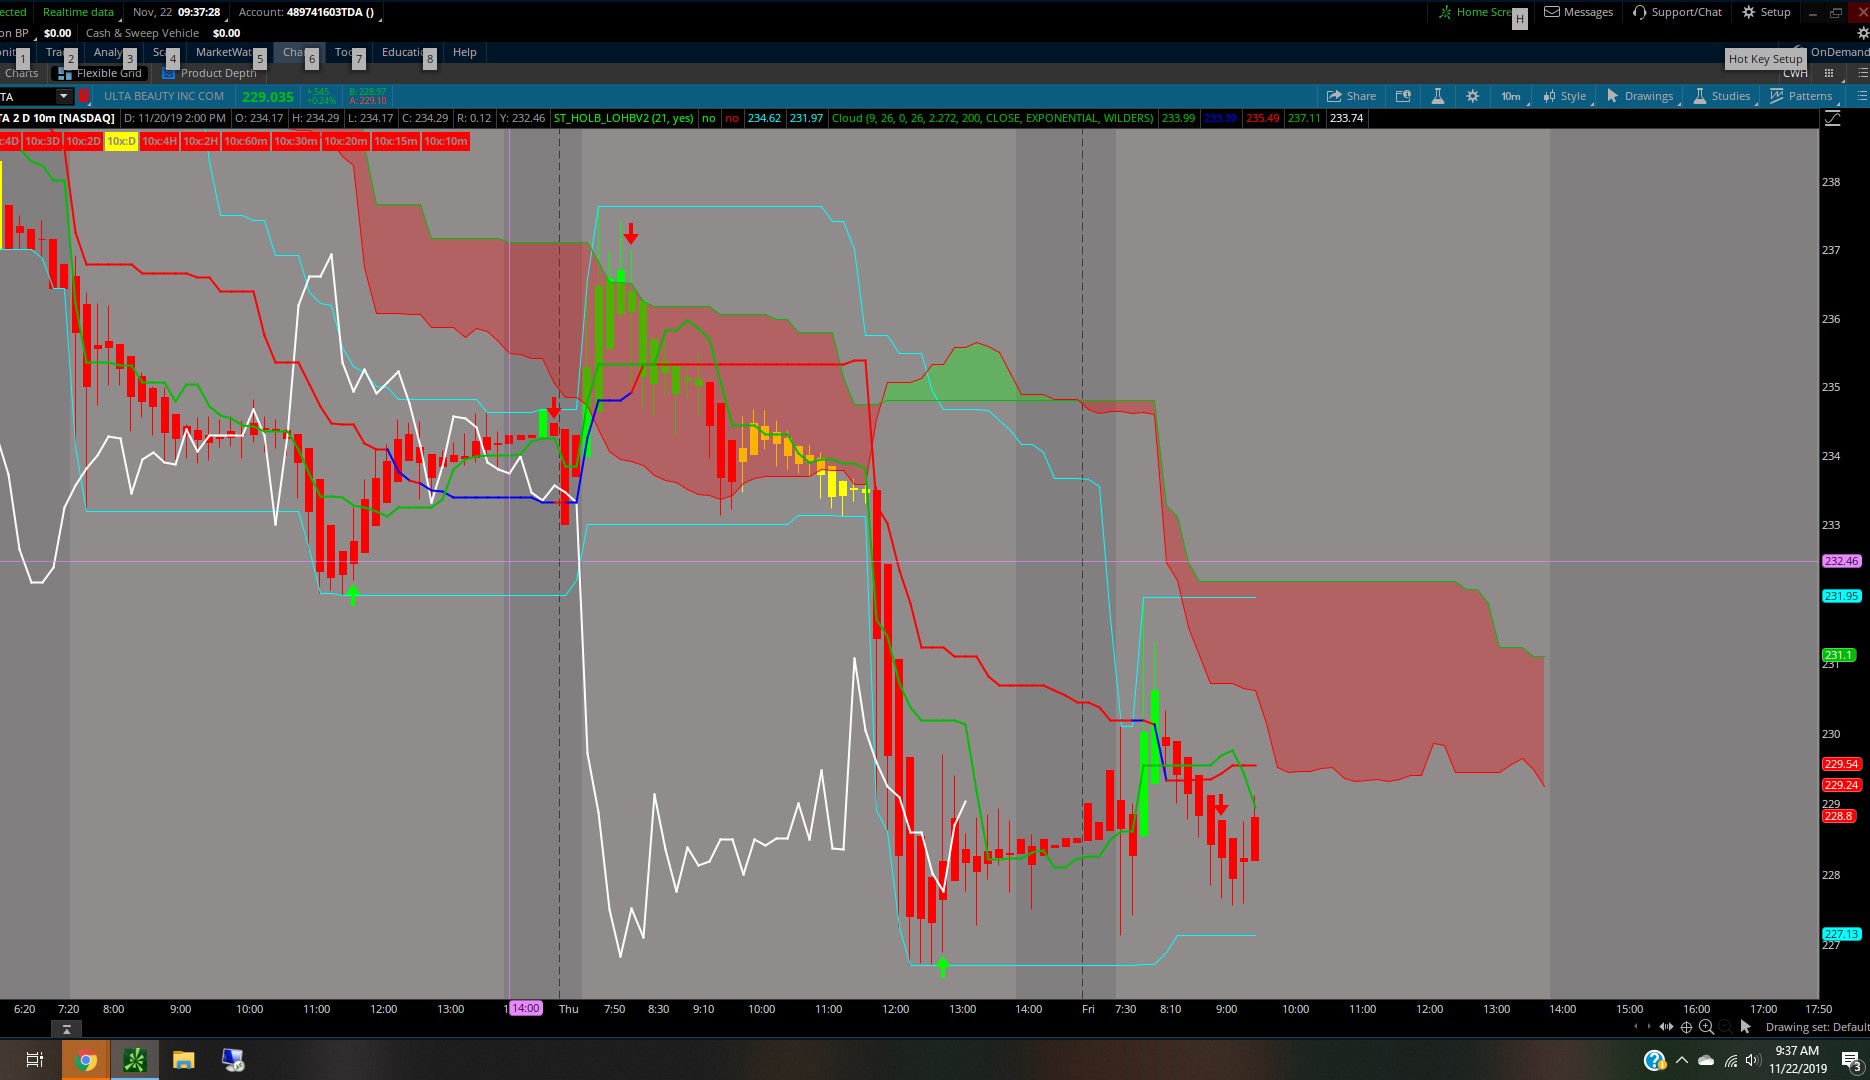
DefineGlobalColor(“Long”, Color.GREEN);
DefineGlobalColor(“Short”, Color.RED);
DefineGlobalColor(“Neutral”, Color.YELLOW);

input DMIlength = 14;
input ADXThreshold = 20;
def ADX = DMI(length = DMIlength).”ADX”;
def DIm = DMI(length = DMIlength).”DI-“;
def DIp = DMI(length = DMIlength).”DI+”;
def long = DIp > DIm and ADX > ADXThreshold;
def short = DIm > DIp and ADX > ADXThreshold;
AssignPriceColor(if long then GlobalColor(“Long”) else if short then GlobalColor(“Short”) else GlobalColor(“Neutral”));

input volumeAveragingLength = 20;
input volumePercentThreshold = 50;
input showVolumeStrengthOnYellow = No;
def aVol = Average(volume, volumeAveragingLength);
def pVol = 100 * ((volume – aVol[1]) /aVol[1]);
def pDot = pVol >= volumePercentThreshold;
plot volumeStrength = if pDot and (long or short or showVolumeStrengthOnYellow) then hl2 else Double.NaN;
volumeStrength.SetPaintingStrategy(PaintingStrategy.POINTS);
volumeStrength.SetLineWeight(5);
volumeStrength.SetDefaultColor(color.cyan);
volumeStrength.hideBubble();

input enableAlerts = NO;
alert(enableAlerts and long and !long[1], “10x Green Alert”, alert.bar, sound.ring);
alert(enableAlerts and short and !short[1], “10x Red Alert”, alert.bar, sound.ring);
alert(enableAlerts and pDot and (long or short or showVolumeStrengthOnYellow), “10x Volume Strength Alert”, alert.bar, sound.ring);

plot scan = if long then 1 else if short then -1 else 0;
scan.hide();

This is is a picture with my MTF indicator showing all are in line except the Daily.

Attachments:
Marked as spam
Posted by (Questions: 49, Answers: 42)
Asked on November 22, 2019 9:38 am
320 views
0
Private answer

For custom scans, there is nothing you can do to the code to accomplish this. The signals of a scan exist for a single time frame that is assigned at the Study Filter level. (which is a level that lies above the code). The code for a Study Filter is not able to reference secondary aggregation periods. The only way you can create scans that reference multiple time frames (MTF) is to apply multiple Study Filters with the same code and set each Study Filter to a different time frame.

A perfect example of this is shown in the following article:

https://www.hahn-tech.com/thinkorswim-mtf-macd-scan/

Edit: The author of the post has requested that this chart study be converted to a scan. When I first answered this question I saw the code provided already had a "plot scan" statement. However after author of the post asked how to scan for a particular signal I realized the code was not suitable to run a scan at all. Here is the portion of the code required to run a scan:

input dmiLength = 14;
input adxThreshold = 20;
def adx = DMI(length = dmiLength).ADX;
def diMinus = DMI(length = dmiLength).”DI-“;
def diPlus = DMI(length = dmiLength).”DI+”;
# use this to scan for long signals
plot long = diPlus > diMinus and adx > adxThreshold;
# use this to scan for short signals
#plot short = diMinus > diPlus and adx > adxThreshold;

Marked as spam
Posted by (Questions: 37, Answers: 4091)
Answered on November 22, 2019 11:25 am
0
Quick question...How do I scan for a color of a bar?
( at November 22, 2019 1:18 pm)
0
Well your code included a "plot scan" statement so I figured you already had that bit worked out. However a scan requires a true/false condition so what you have in your code is not a plot statement you can use for a scan. I have updated my answer to include the portion of your code that can be use as a scan.
( at November 22, 2019 3:07 pm)
0
Thanks Pete...The scan work great
( at November 22, 2019 5:54 pm)