Scan for MA cross in a 30 min timeframe


Category:
0
0

Hello,

I would like to get help on the code that can scan for MA 20 crossing above MA 50 in a 30 mins or one hour time frame please? It should scan for any cross for the last N bars (let’s say the last 14 bars that correspond to the whole day in case of 30 mins time frame). That is the main scan I want for now, however, any advice on how to extend that scan to scan for the first Parabolic Sar dot appearance and the first ashi keiken green bar on a daily time frame would be greatly appreciated.

Thank you very much in adavance

Marked as spam
Posted by (Questions: 6, Answers: 8)
Asked on January 18, 2018 12:15 pm
172 views
0
Private answer

The moving average crossover is a built in scan so we don’t need any code to do that one. See attached screenshot for an example of how to chain together multiple tests to check for crosses having occurred X bars ago. (you will need to add additional lines to account for your 14 bar lookback)

“First parabolic SAR dot appearance” is too vague. Need more details. The first dot appears on the first bar of the chart. So obviously you intended to communicate something different. But I don’t know what that might be. And we may even put that in another post altogether. Have you searched the Q&A forum? There has been very broad coverage of the PSAR.

“ashi keiken”. I am not familiar with this term. You will need to provide more details. Seems as though you may have intended to type Heiken Ashi?

Unless you have a description of how you want all three of these elements wrapped up into a single scan I am going to recommend you break these other two questions into separate posts. This will help folks search for a find those solutions on their own merit.

Attachments:
Marked as spam
Posted by (Questions: 37, Answers: 4091)
Answered on January 18, 2018 2:23 pm
0
Thank you Pete for your answer and sorry for the confusion. 1st: I knew there was a built crossover scan which I already used, however as I already mentioned I want to scan for crossovers that may have appeared in 30 mins time frames for the last let’s say 13 bars, so I was wondering if there was a code that can do that instead of using the condition wizard to create 13 lines of codes. Yes Pete I did go through all the 11 pages of the Scans Q&A, but I could not find what I wanted. The description of all three elements combined in one scan is as follows: 1st I would scan for any exp MA crossovers for the last 13 bars in 30 mins time frames; if any crossovers were found then the scan will check if we have a bullish SAR dot under the previous daily closing bar AND a bullish green Heiken Ashi in a daily time frame. If all of these three conditions were met then a buy signal is generated. If more clarifications were needed I will try to upload a screenshot. Thank you Pete
( at January 18, 2018 3:43 pm)
0

Pete, I am trying to edit the original post to attach a picture but I get a white empty box!

( at January 18, 2018 4:16 pm)
0

yeah, I know. not sure why but that feature has never worked. I’ll check the settings. but if you need to add a screenshot you’ll need to post is at a new answer to this question.

( at January 18, 2018 4:19 pm)
0

I attached the pic, but when I post the answer I get “content can not be empty” error message. I could not add any text in the box because it is not clickable. For now just let me know if you have any questions in regard to my previous question clarification. Thanks

( at January 18, 2018 4:55 pm)
0
Private answer

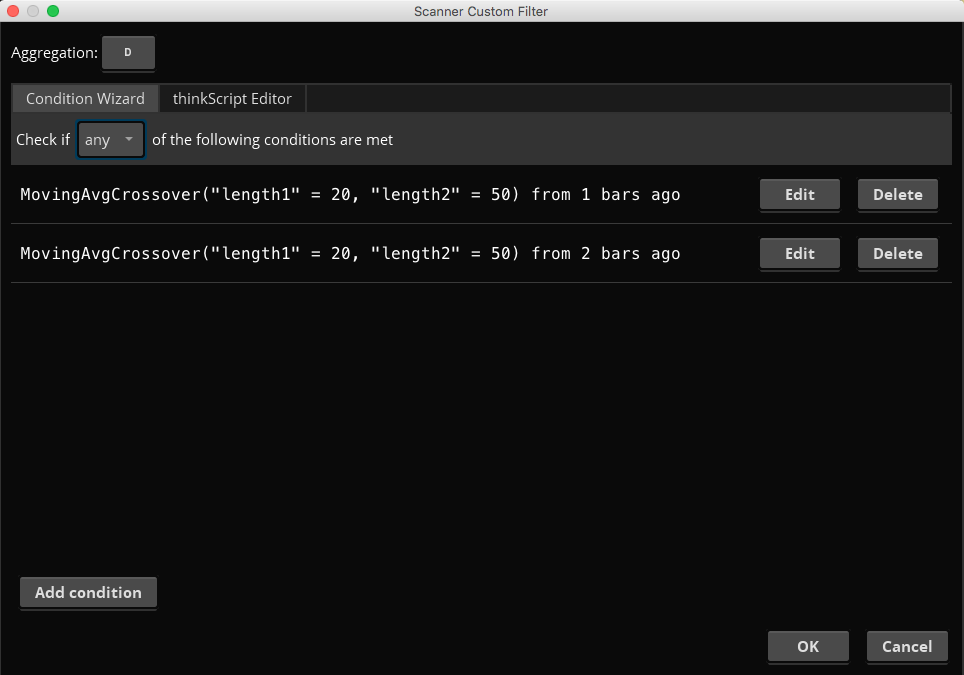
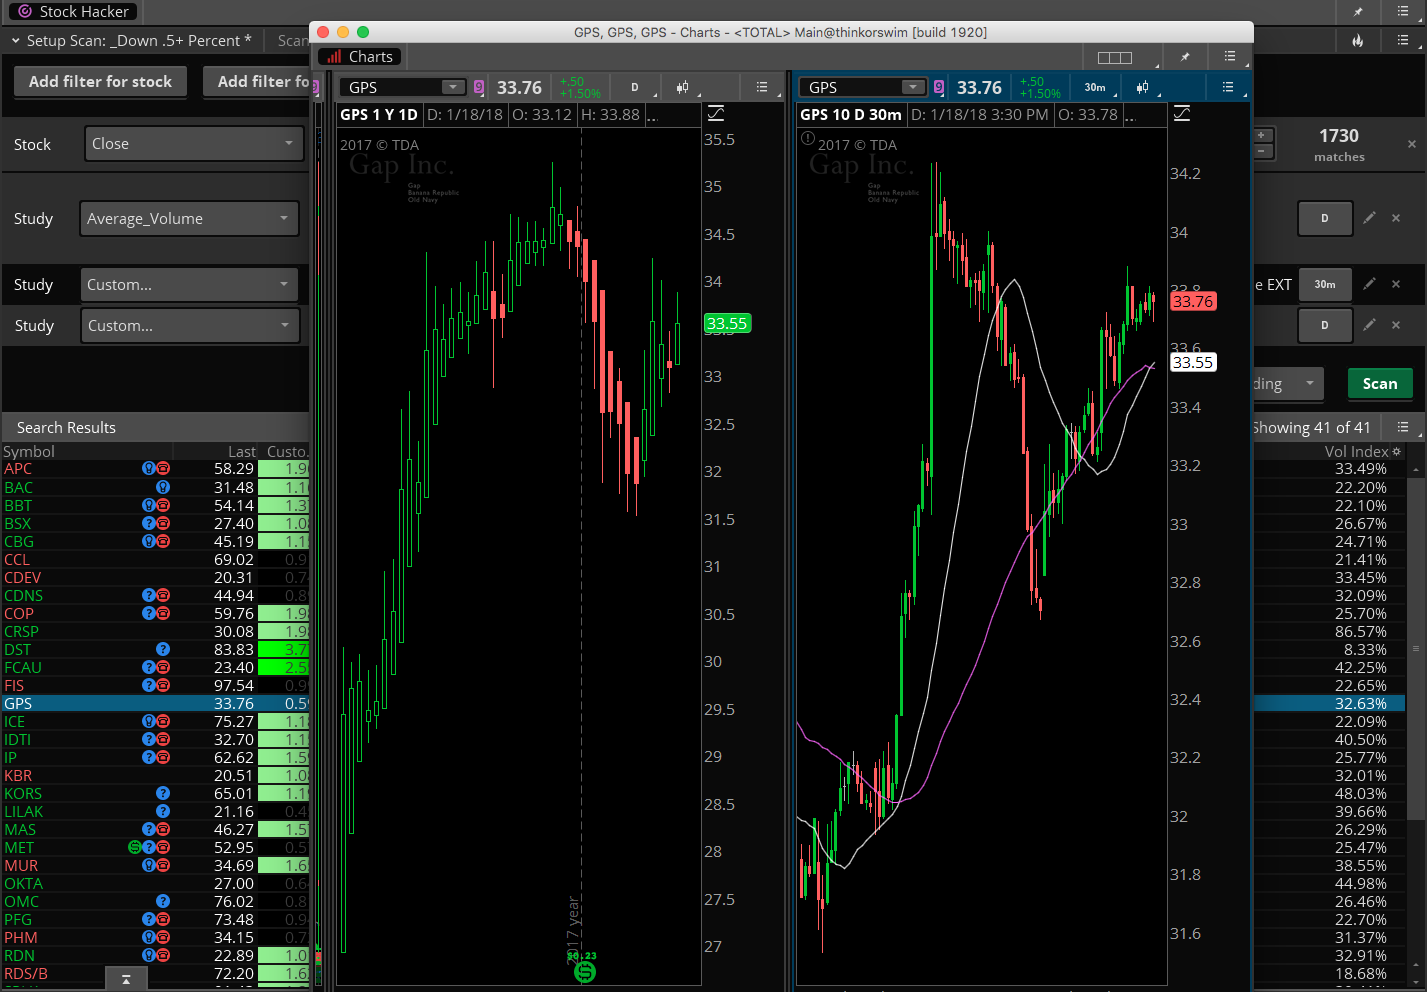
Ok, after some further details I have an more detailed solution. Attached screenshot shows the scan layout with results. As well as a chart setup to show the essential elements of the scan. I am providing two pieces of code. The first is the one that checks for moving average crossover within the last 14 bars. This will be added to the custom scan as a study filter set to 30 min time frame.

def ma20 = Average(close, 20);
def ma50 = Average(close, 50);
def crossAbove = ma20[1] < ma50[1] and ma20 > ma50;
# crossAbove is true/false and returns a numeric value of 1 or zero
def crossWithin14 = Highest(crossAbove, 14) > 0;
# crossWithin14 checks for the highest value of crossAbove within 14 bars
# and returns true if the lowest value is greater than zero.
plot scan = crossWithin14;

The next piece of code combines both the PSAR along with the Heiken Ashi. Because Rachid has explained that both of these filters should operate on the daily time frame. So when adding this as study filter to the scan, make sure you sent the time frame to Daily.

# Parablic SAR
input accelerationFactor = 0.02;
input accelerationLimit = 0.2;
def psar = ParabolicSAR(accelerationFactor, accelerationLimit).parSAR;
def psarTrigger = psar[1] < close[1]; # Heiken Ashi def haClose = ohlc4; rec haOpen = CompoundValue(1, (haopen[1] + haclose[1]) / 2, (open[1] + close[1]) / 2); def adjOpen = Round(haOpen / TickSize(), 0) * TickSize(); def adjClose = Round(haClose / TickSize(), 0) * TickSize(); def haTrigger = adjClose > adjOpen;
plot scan = psarTrigger and haTrigger;

Ok, that’s all I have.

Attachments:
Marked as spam
Posted by (Questions: 37, Answers: 4091)
Answered on January 18, 2018 5:00 pm
0

Thanks Pete. I will setup this scan tomorrow or after tomorrow then I will let you know how it goes.

( at January 18, 2018 5:29 pm)