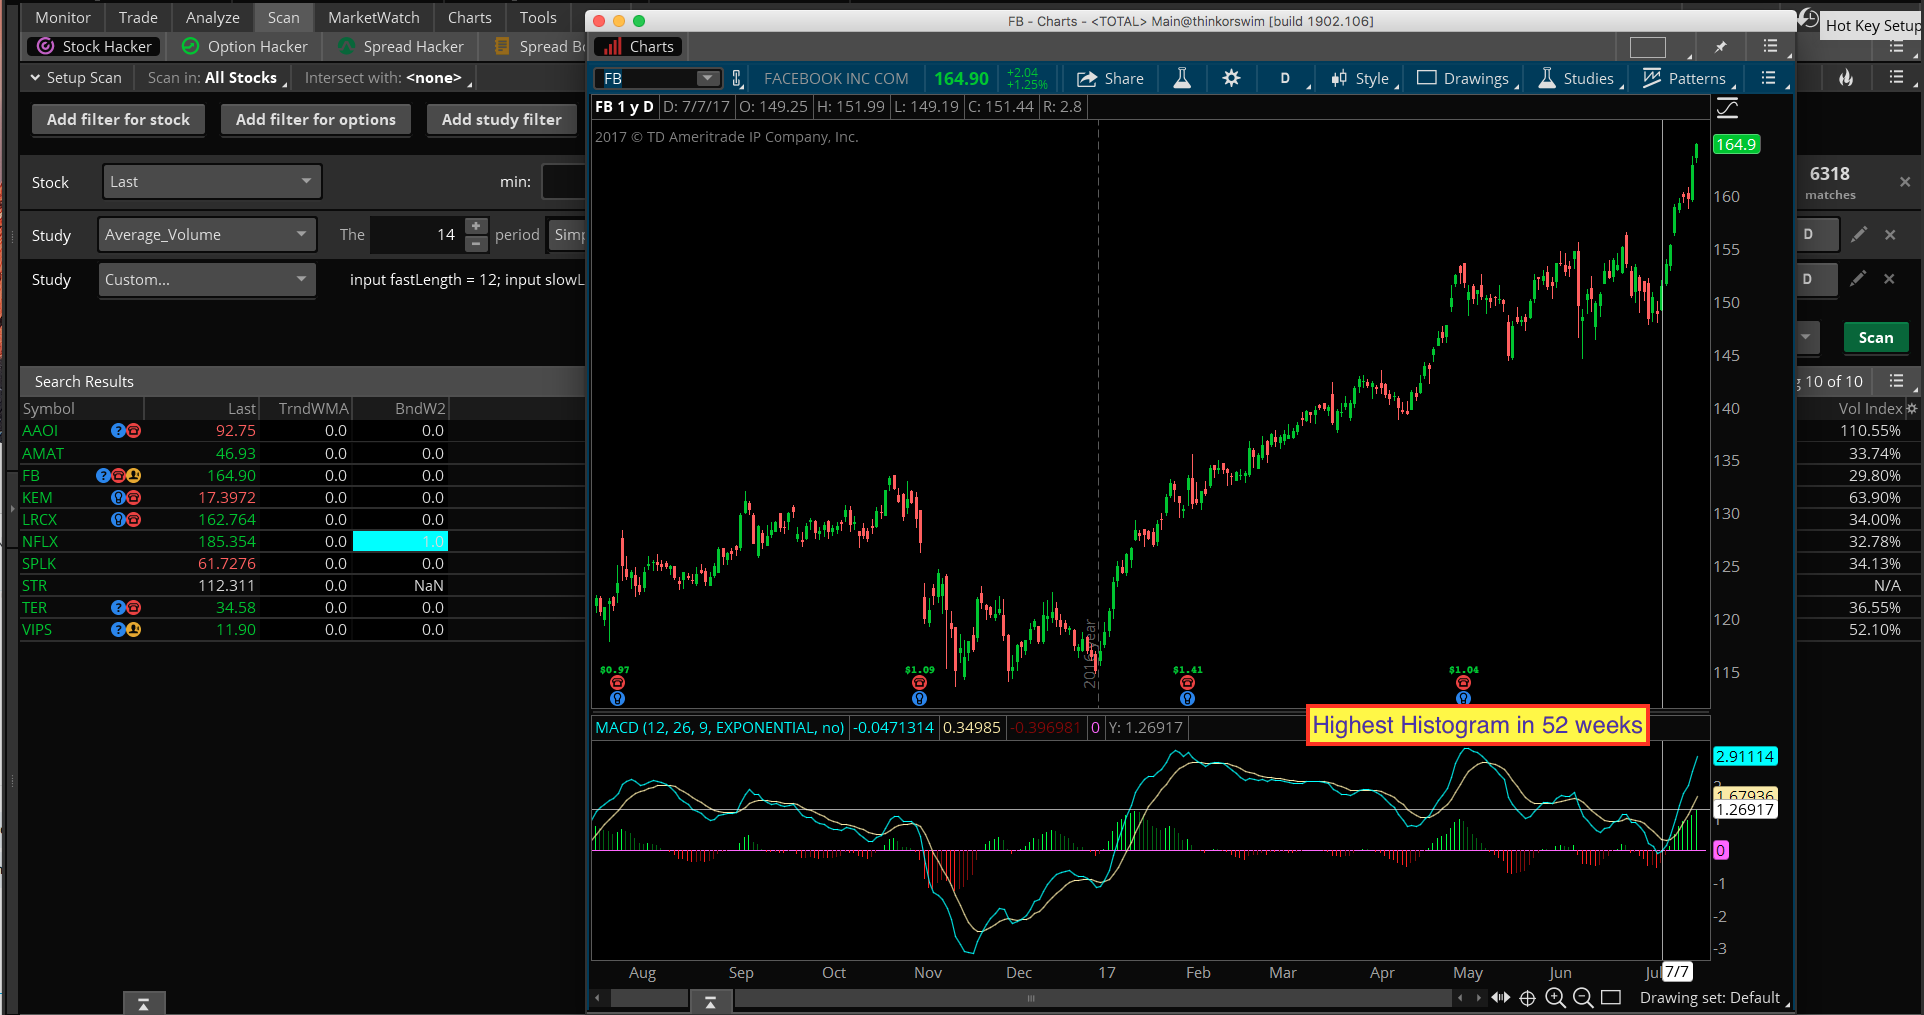
In response to a request to modify the code to account for MACD “near or at” it’s 52 week high. The following code provides this functionality. A very important thing to note is that using the default setting of 1.0 percent will make the signal extremely rare.
input fastLength = 12;
input slowLength = 26;
input MACDLength = 9;
input averageType = AverageType.EXPONENTIAL;
input percentLimit = 1.0;
def factor = 1 - (percentLimit * 0.01);
def Value = MovingAverage(averageType, close, fastLength) - MovingAverage(averageType, close, slowLength);
def Avg = MovingAverage(averageType, Value, MACDLength);
def Diff = Value - Avg;
# use this scan to find 52 week high MACD Histogram
plot scan = Diff <= Highest(Diff[1], 252) and Diff >= Highest(Diff[1], 252) * factor;
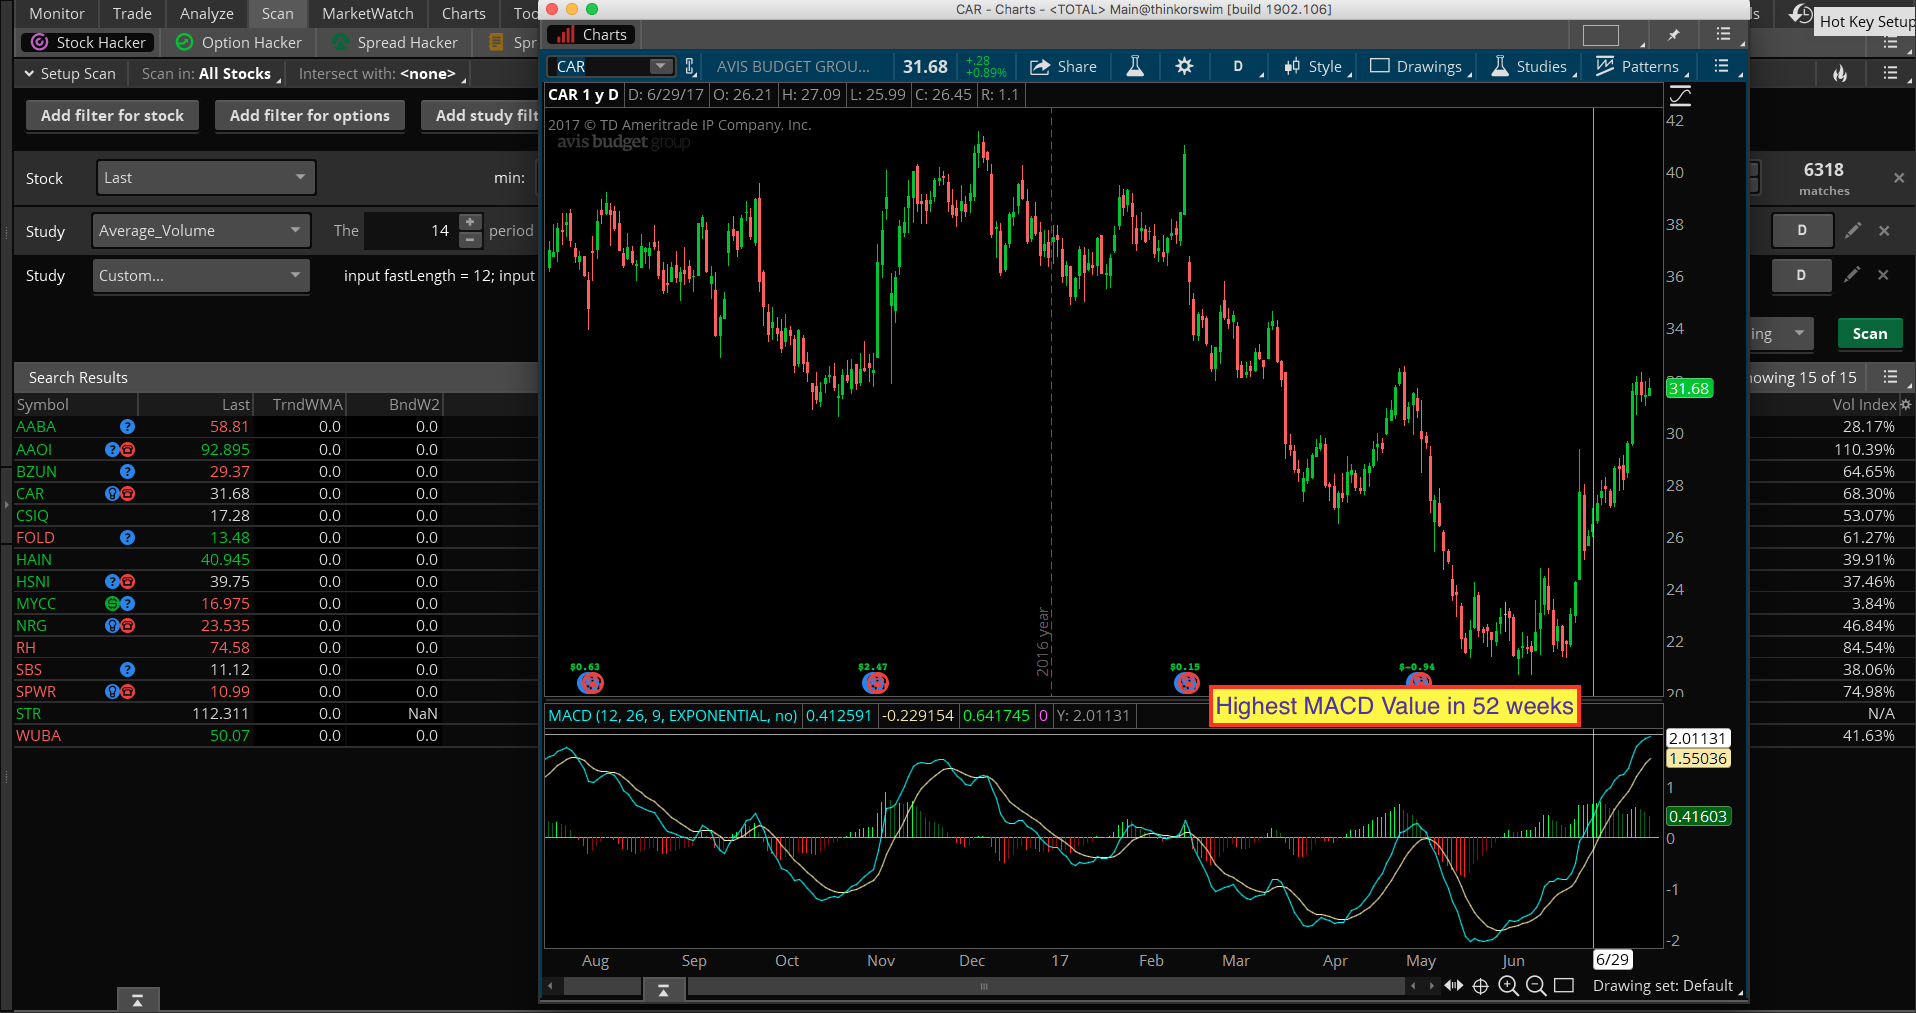
# use this scan to find 52 week high MACD Value
#plot scan = Value < Highest(Value[1], 252) and Value >= Highest(Value[1], 252) * factor;
Would there be any way to set up a scan to look back at least 4 years in a monthly time frame?
As you mentioned it only works with the daily time frame…
No. As stated in previous posts, there is a limit of two years historical data available for scans. This limit applies to daily time frame and higher.
Just need to define how that is calculated. ”…at the same level…” that is easy, just use an equal sign. ”…or just below…”, that one needs to be clearly defined. Show me the math you want to use and we can incorporate that.
lets say 1 percent less than the highest 52-week macd high….
where would the equal sign be, should the > be replaced by = in the same code?