| ♥ 0 |
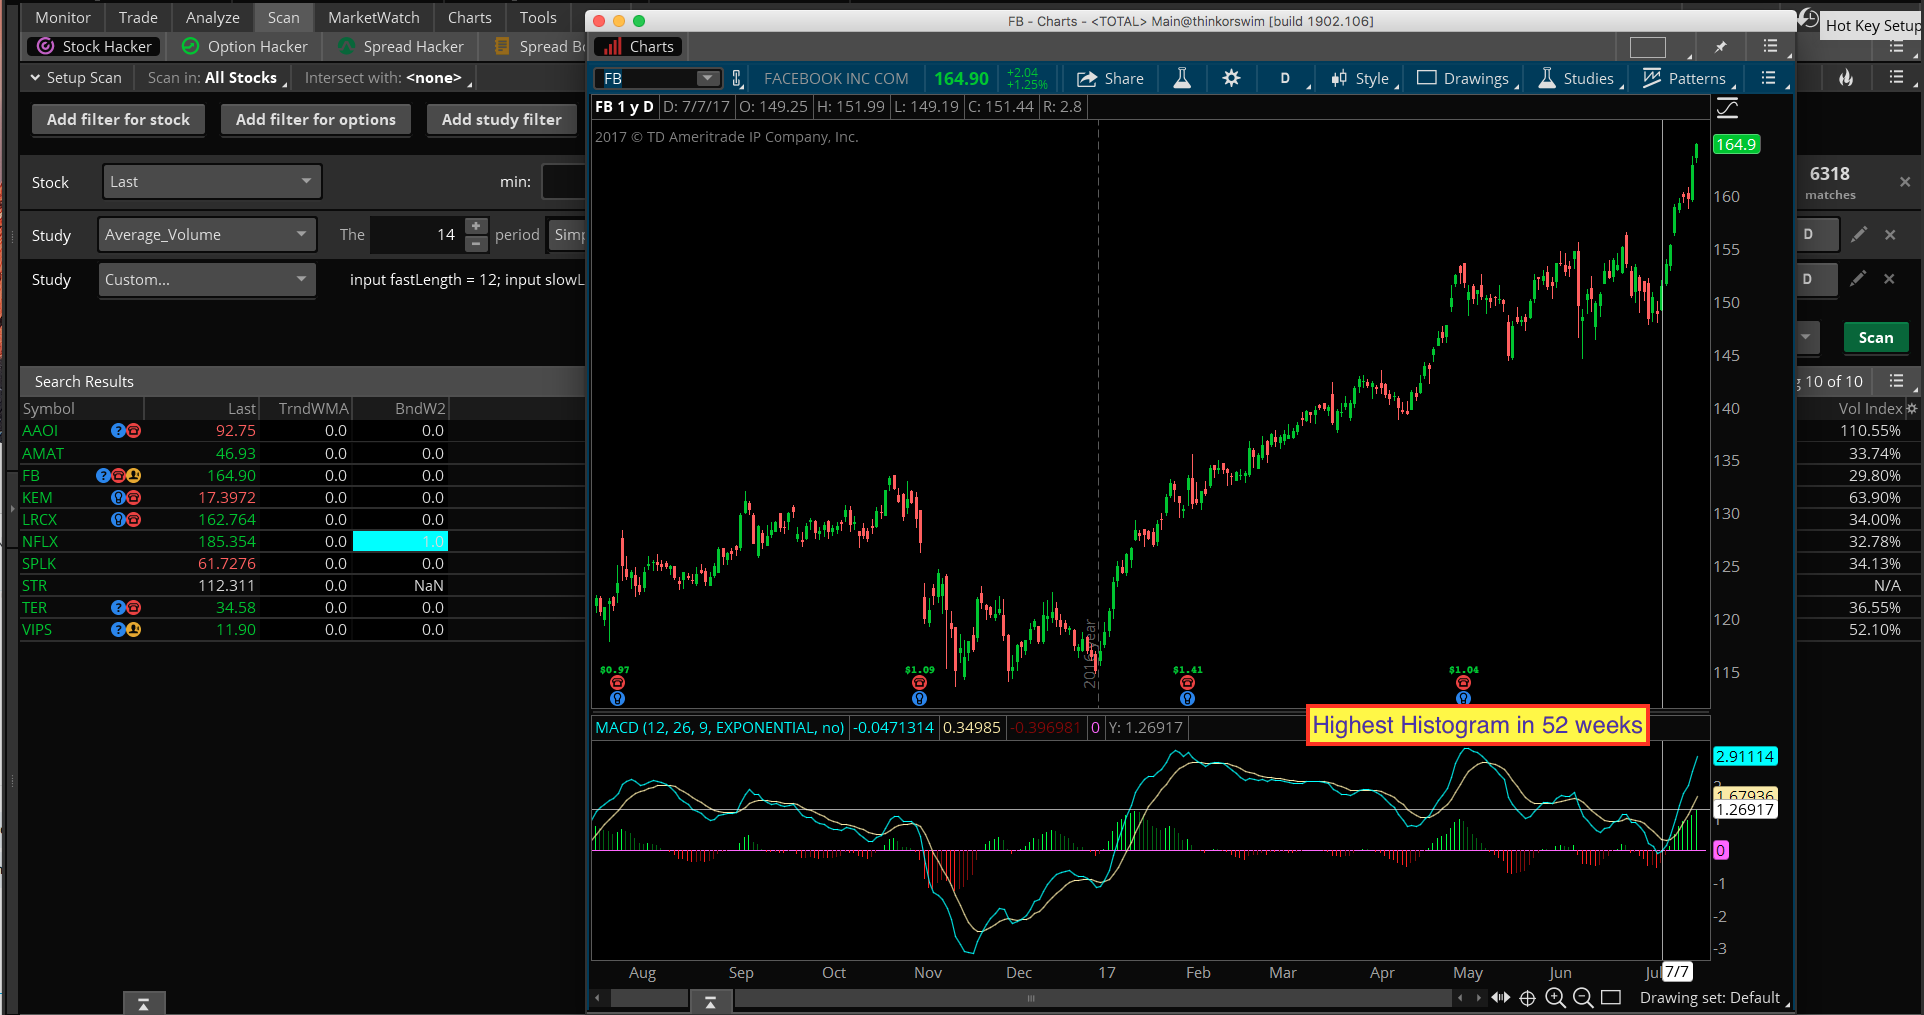
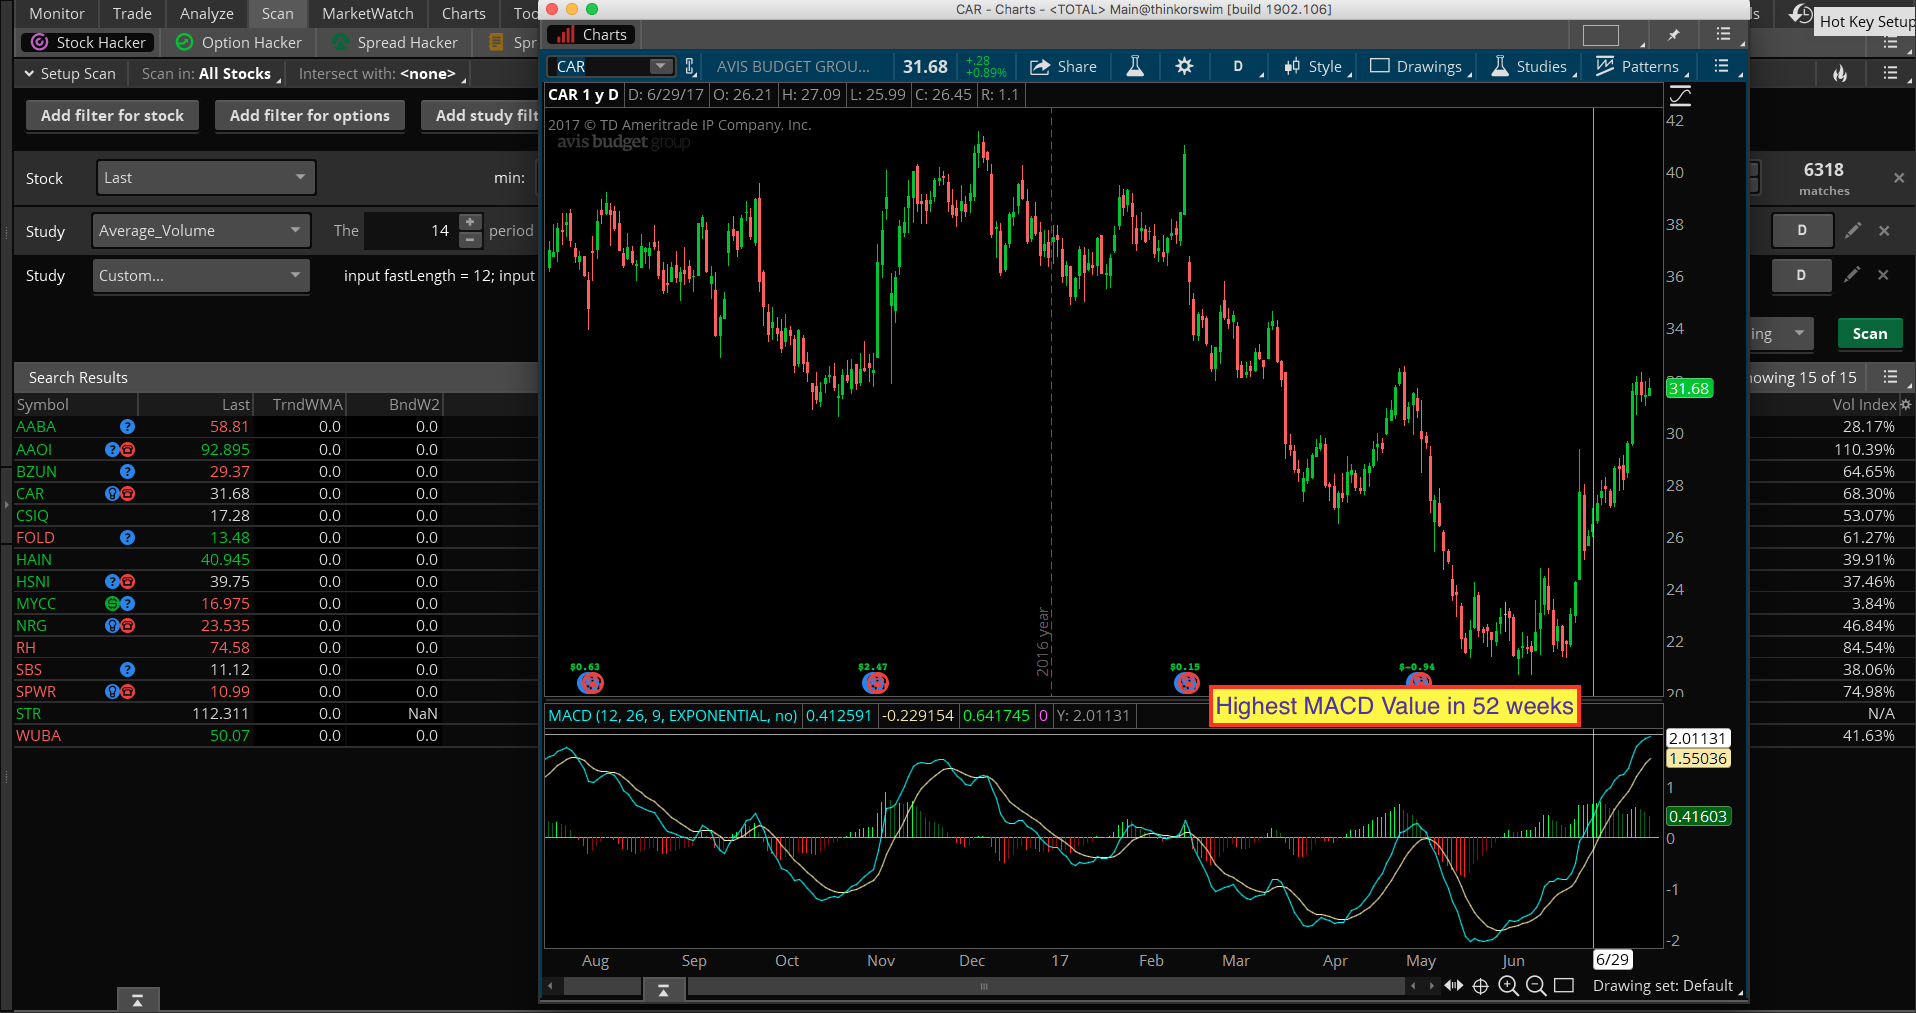
I am trying to find stocks that have 52-week high MACD levels.
If you skip to minute 13 of this video you will see why this scanner should be very helpful.
Marked as spam
|
|
Private answer
In response to a request to modify the code to account for MACD “near or at” it’s 52 week high. The following code provides this functionality. A very important thing to note is that using the default setting of 1.0 percent will make the signal extremely rare.
Marked as spam
Answered on July 25, 2017 2:49 pm
|
|||||||||||
|
Private answer
Thank you Mr. Hahn. Marked as spam
Answered on July 19, 2017 8:51 am
|
|||||||||||
|
Private answer
Only need to add a single line of code to accomplish this. Two if you want the option of scanning for both the Histogram and the MACD Value. Here is the full code, taken from the builtin MACD study included with Thinkorswim. The scan must be run on a daily time frame. Screenshots included below showing both modes of operation.
Attachments:
Marked as spam
Answered on July 19, 2017 7:58 am
|
I noticed it is rare indeed because the scanner didn’t find any stocks, I tried deleting the one percent requirement so that the scan would just search for a MACD 52-week equal high but did not work either, I am sure there is a way to code it but I’m just not sure how to.
Let’s pretend this is the MACD and the right hand side is at exactly the same high as in the past, this is
what I am trying to scan for. Hopefully I explained it correctly.
\ / < ~~~~~~~~~~~~~~ scanning for this edge, not over past higher highs. \ / \____ /
Eliminating the percentage would actually make it nearly impossible to find a signal. The MACD being exactly the same as a previous value is almost never going to happen. If you want to increase the frequency, keep the percentage filter and increase the percentage value. Start at a very high number, say 50%. Then work your way down until you get just a few results.
Thank you for clarifying Pete