Scan for opening range breakout in custom study


Category:
0
0

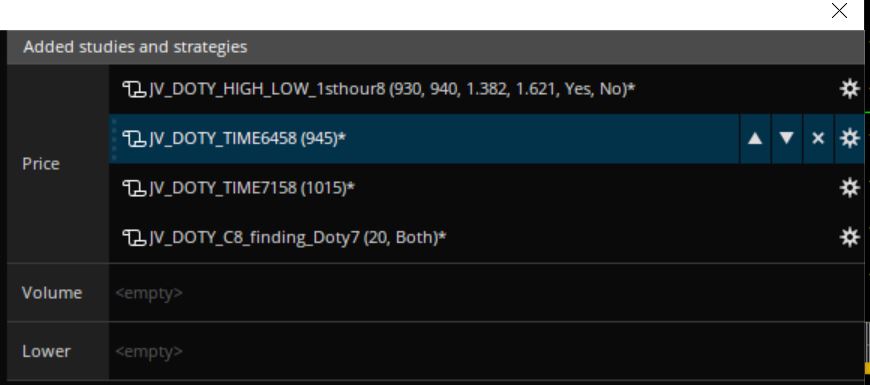
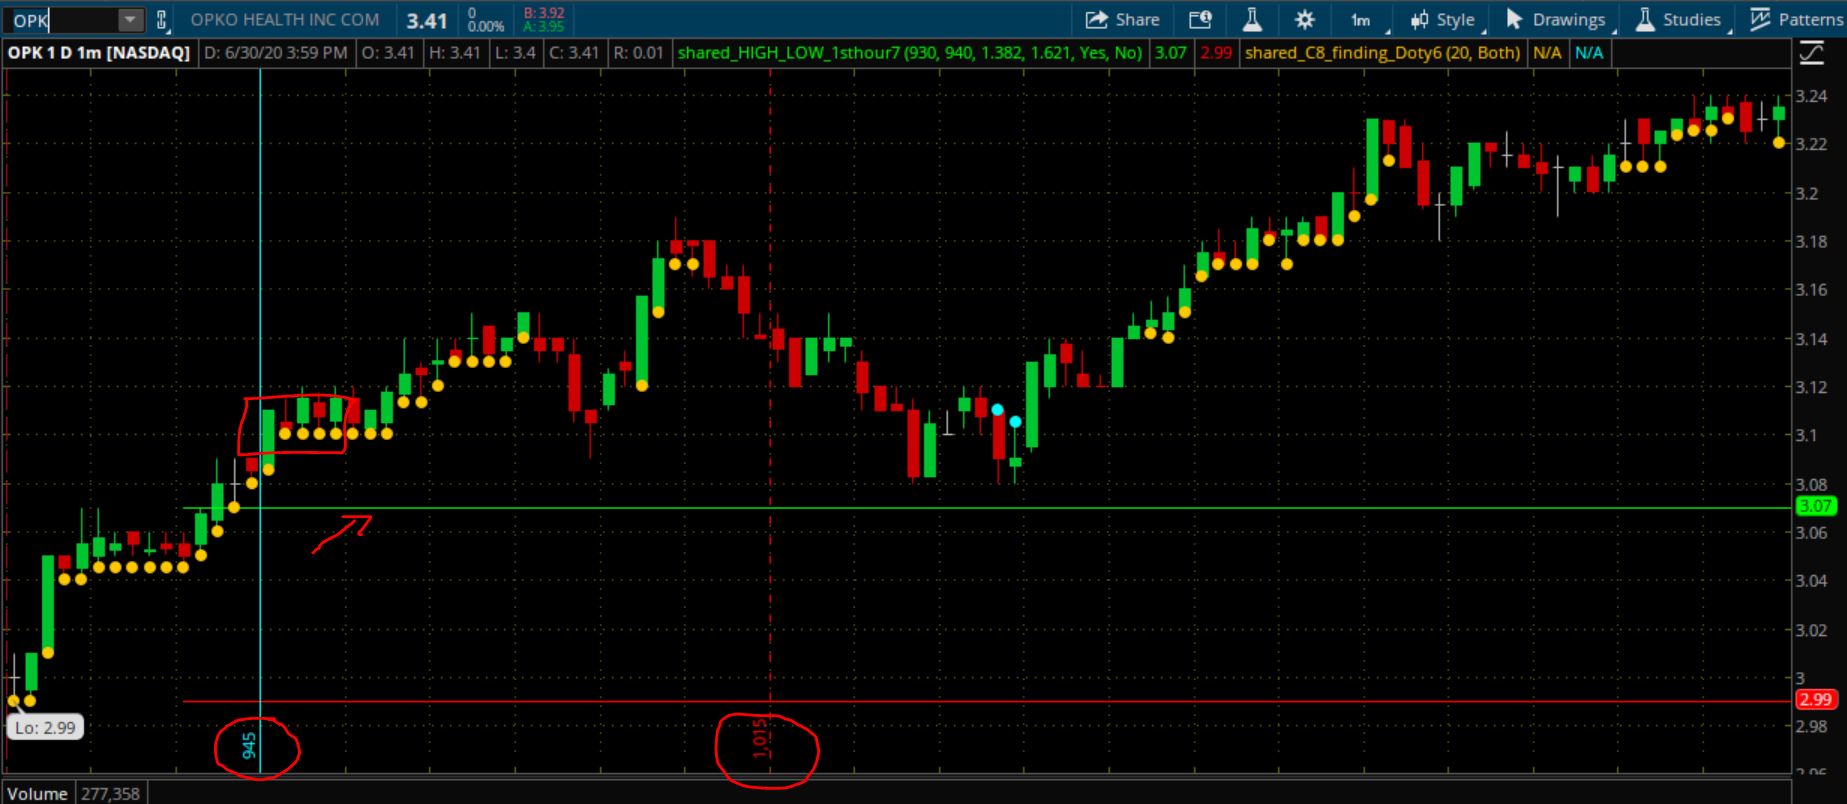
Hi Pete,

I came across a custom study on the web which seems to give decent results (for some stocks I follow).

I have attached the 4 studies in both .ts and txt format as I am not sure which format you prefer.
I use them all in the Price section of the chart studies.

Is it possible to have a scan, which scans 4 candles with yellow dots in a row above the green horizontal line between 9.45 and 10.15 am?

Screenshot of a symbol for few days ago also attached..

Looking forward for your guidance of this possibility.

Thanks

Jay

Marked as spam
Posted by (Questions: 6, Answers: 7)
Asked on July 2, 2020 1:47 am
300 views
0
Private answer

So does it require all four individual studies to produce those dots? If so, then this is way beyond the scope of what I can provide for free in the Q&A forum. All of those studies would need to be combined into one piece of code to run as a scan. But I haven't even looked at the code to see if its possible.

Marked as spam
Posted by (Questions: 37, Answers: 4086)
Answered on July 2, 2020 10:55 am
0
Hi Pete, JV_DOTY_C8_finding_Doty7 is the code in which I believe produces the dots. Other code is for plotting the lines. Thanks
( at July 2, 2020 12:07 pm)
0
Ok, thanks for confirming that. This is some really crappy code. I don't even want to touch this. Gives me a headache just reading it.
( at July 2, 2020 6:03 pm)