Scan for price crossing above 200 sma while below 50 sma


Category:
0
0

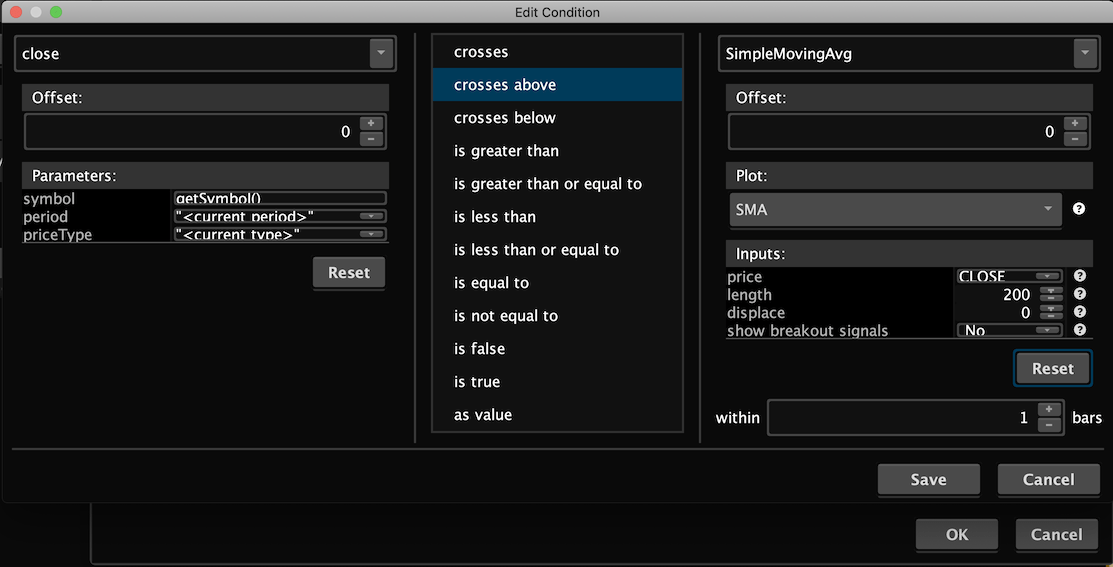
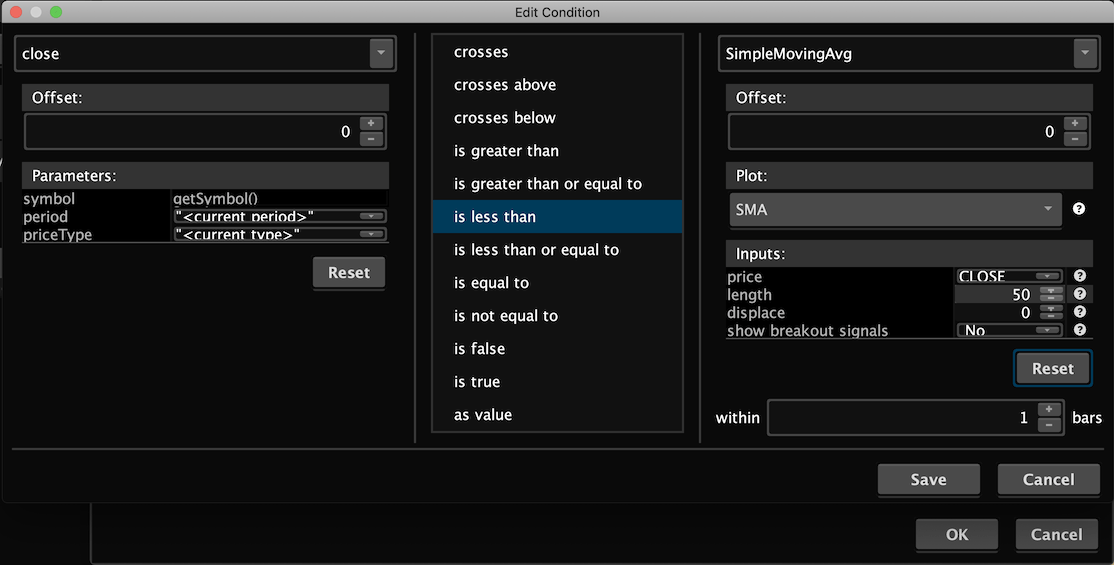
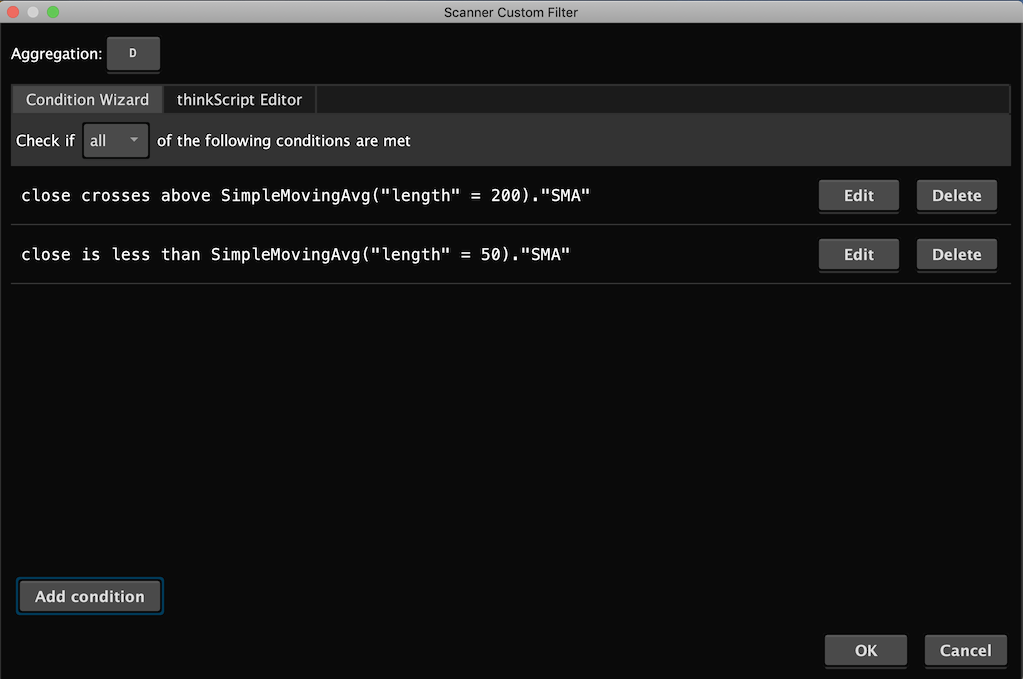
I’ve not researched if this has been asked in the past so forgive me if so. I did see the approaching 200SMA study but I’m struggling with a code that shows price crossing the 200SMA on the current daily bar and finding it in a scan. What I want is when the price crosses the SMA 200 and the price is below the 50 SMA. I have other requirements for RSI but I know how to add them and left them out on purpose.

Here’s my code

input price = close;
input length1 = 50;
input length2 = 200;
input barsAfterCross = 1;

def SMA1 = SimpleMovingAvg(price, length1);
def SMA2 = SimpleMovingAvg(price, length2);
def crossBelow = price < SMA2[1];

#use this to scan for bearish burst
plot scan =  crossbelow [barsAfterCross +1] and price < sma2;

Marked as spam
Posted by (Questions: 21, Answers: 47)
Asked on May 2, 2019 6:45 am
565 views
0
Private answer

I updated the title of the question to more clearly reflect the context of your request. My solution here requires no coding skills whatsoever. I used the condition wizard to build the study filter. Just a few clicks and the study filter is complete. Adding the RSI component may be just as easy, but you didn't provide any details for that.

I encourage all our viewers to spend time learning how to work with the condition wizard. You can build very complex and detailed scans without knowing one thing about writing code.

Screenshots below show the basic steps required to build this scan.

Attachments:
Marked as spam
Posted by (Questions: 37, Answers: 4084)
Answered on May 2, 2019 11:27 am
0
I completely overlooked this and will spend more time using this. RSI is simple, needs to be greater than 30 and length is 20 not 14. I can add that. Thank you again for your assistance.
( at May 2, 2019 3:39 pm)