| ♥ 0 |
Hi Pete,
Wondering if possible in TOS to scan fro stocks that made 52 week high within this time frame 7/10 to 7/30
Marked as spam
Asked on September 27, 2017 6:38 am
3194 views
|
|
Private answer
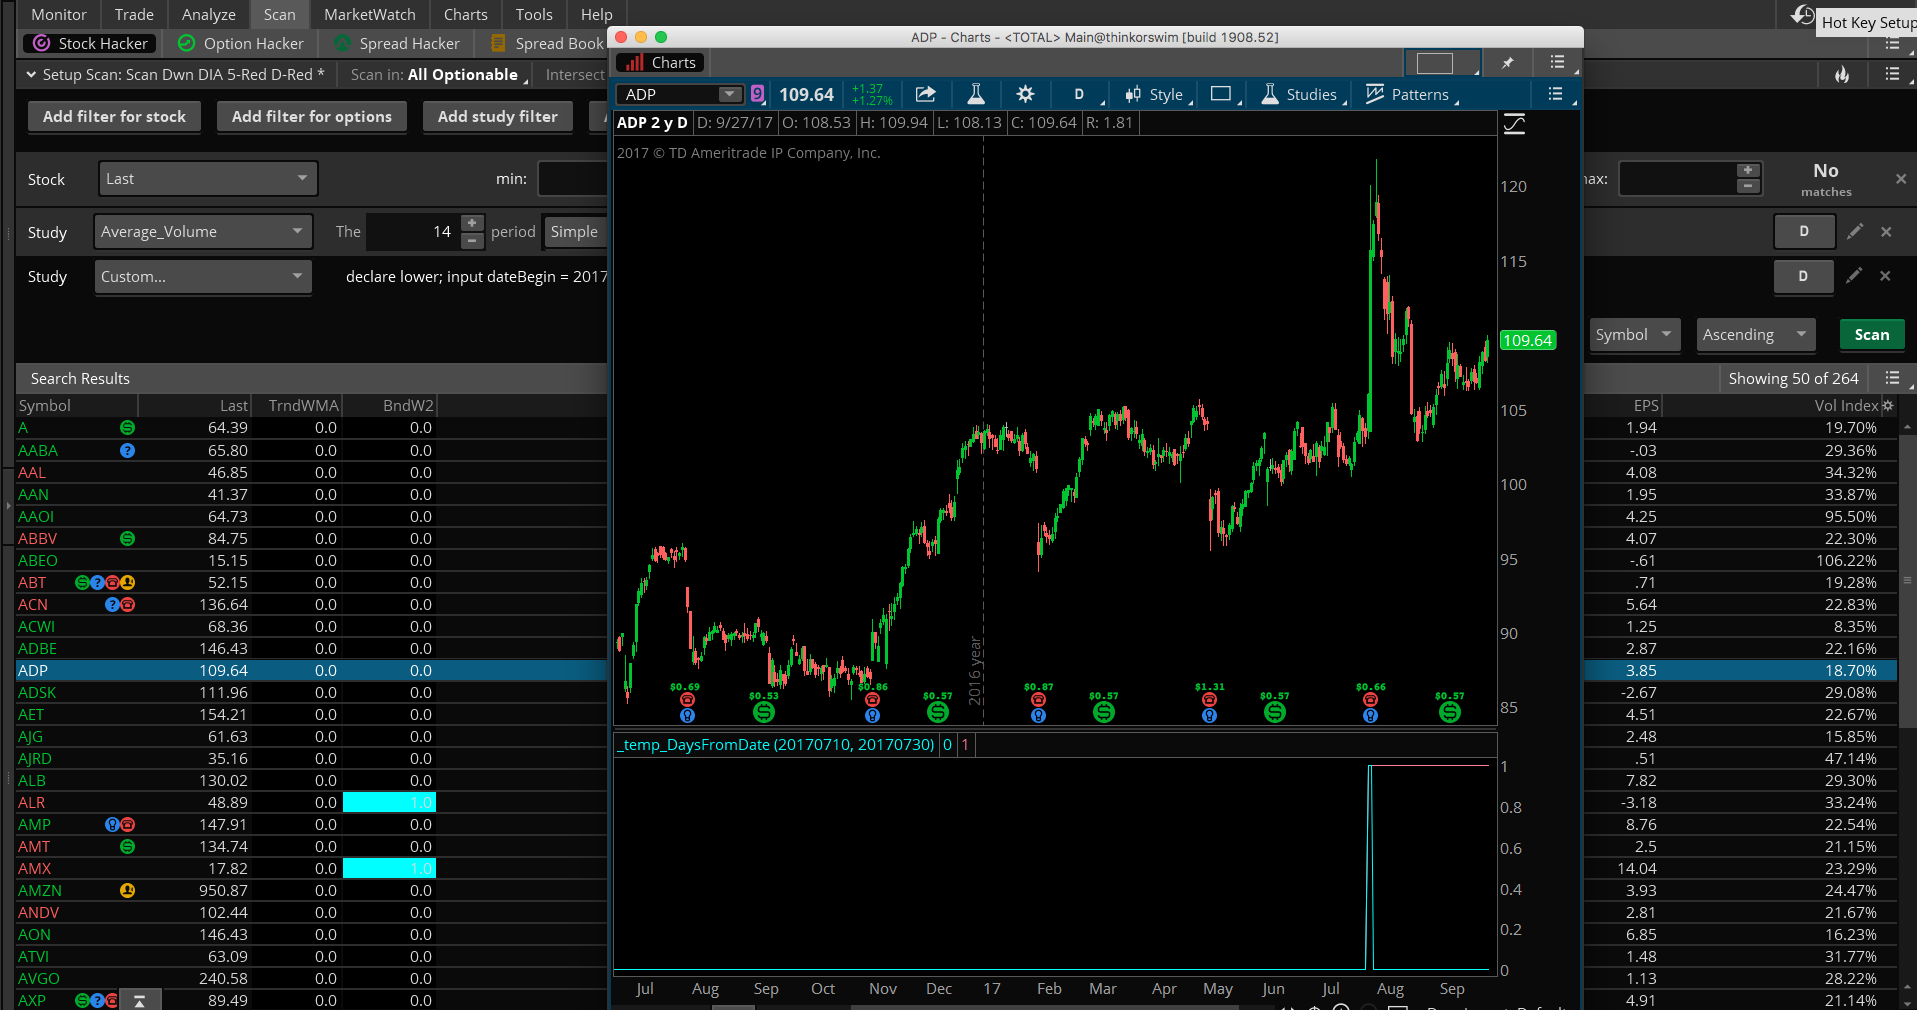
We can do this in just a few lines of code. We are making use of two built in functions: DaysTillDate() http://toslc.thinkorswim.com/center/reference/thinkScript/Functions/Date—Time/DaysTillDate.html and DayFromDate() http://toslc.thinkorswim.com/center/reference/thinkScript/Functions/Date—Time/DaysFromDate.html Here is the code. The screenshot that follows shows scan results and sample chart.
Attachments:
Marked as spam
Answered on September 27, 2017 2:29 pm
|
You may be able to use the function named GetYYYYMMDD() to get today’s date. You can read more here: http://toslc.thinkorswim.com/center/reference/thinkScript/Functions/Date—Time/GetYYYYMMDD.html
If you can’t get it working then I suggest you post this as a new topic to avoid confusing future visitors to this post. Seems to me that my response to the original request covers what you are asking. So if you post this in a new question be sure to explain things in more detail.