| ♥ 0 |
How would I create a scan for Tweezer Tops or Tweezer Bottoms as they relate to the Bollinger Bands ? Specifically, Bollinger Band settings are: displace 0, length 21, number of deviations down -2, number of deviations up 2 and average type simple. For Tweezer Top formation (two candle pattern): candle from one bar ago opens below the top Bollinger Band and then closes above it. Current candle opens above top Bollinger Band and then closes below it. Within the Condition Wizzard (Edit Condition) I am not sure what settings to use for all the “Offset” boxes or the “within….bars” box. If I run the scan at the end of the day of course it will be using the closing price for today. Would it be possible to adjust the aggregation period to say 2 hours and run the scan at the close of the last candle on a 2 hour chart throughout the day ? Would the scan be able to recognize this Tweezer Top pattern formation on a 2 hour chart ? I would assume everything in reverse for a Tweezer Bottom scan. Any guidance would be appreciated. Attachments:
Marked as spam
Asked on October 17, 2022 8:11 pm
477 views
|
|
Private answer
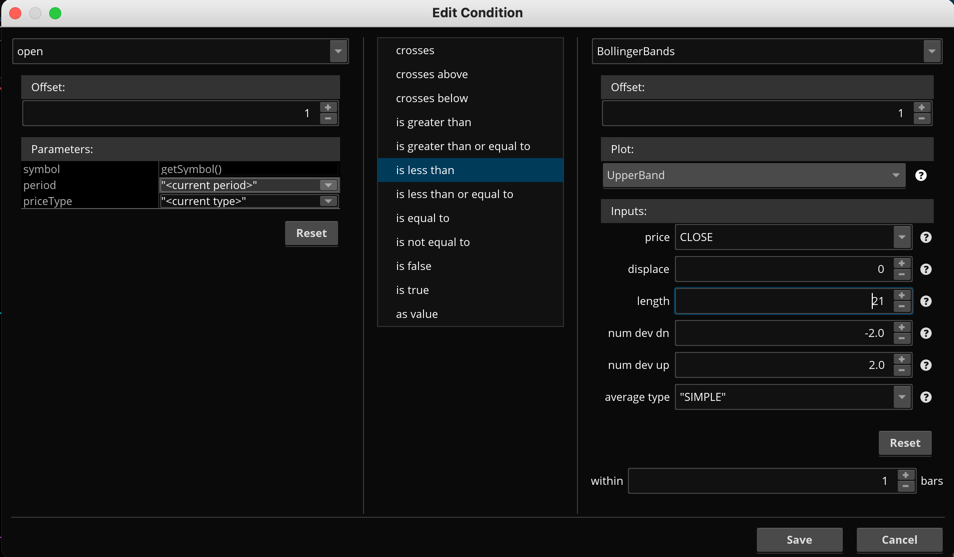
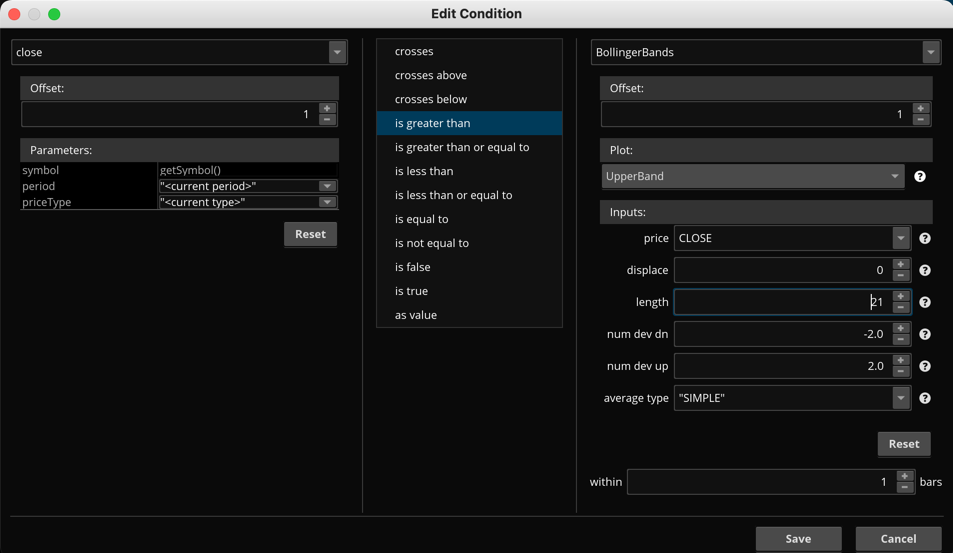
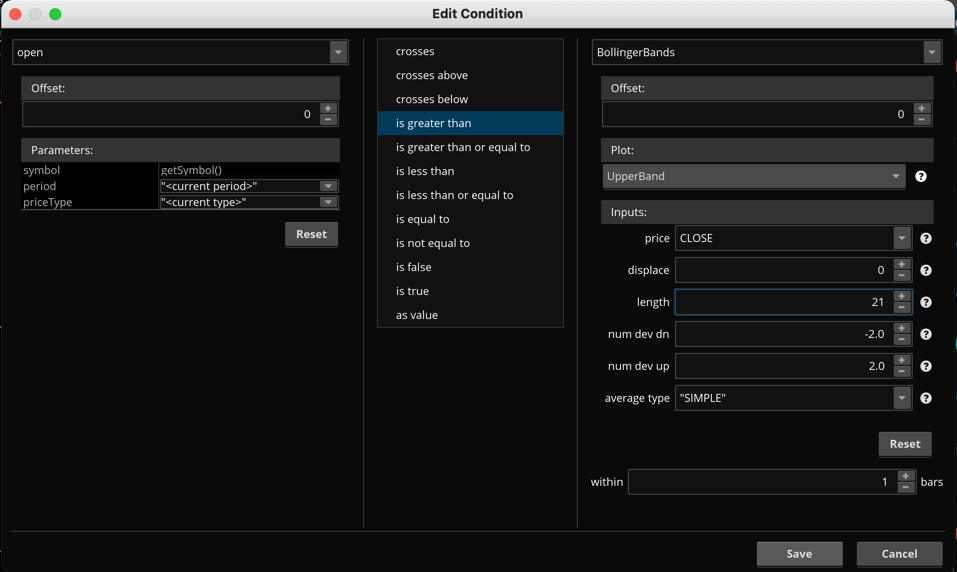
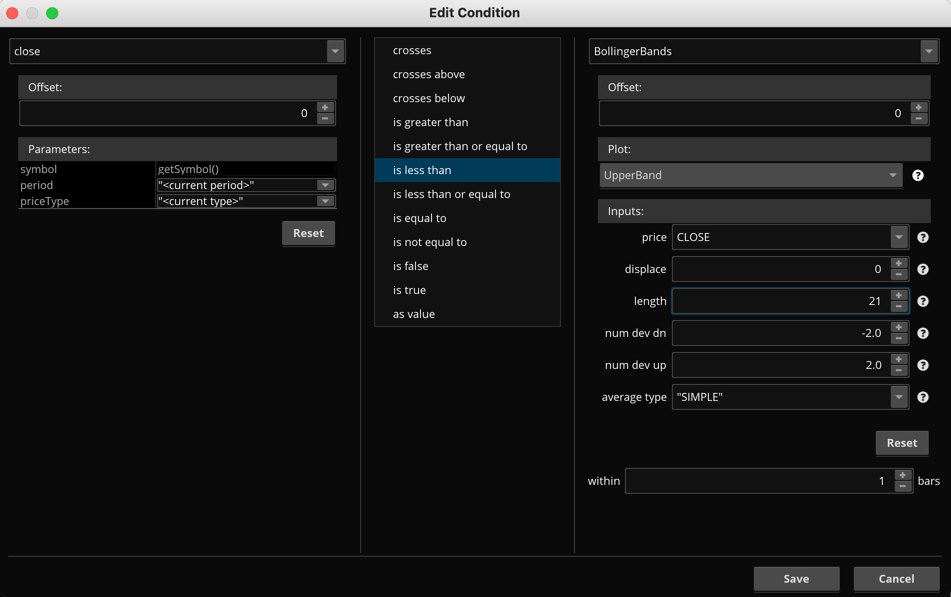
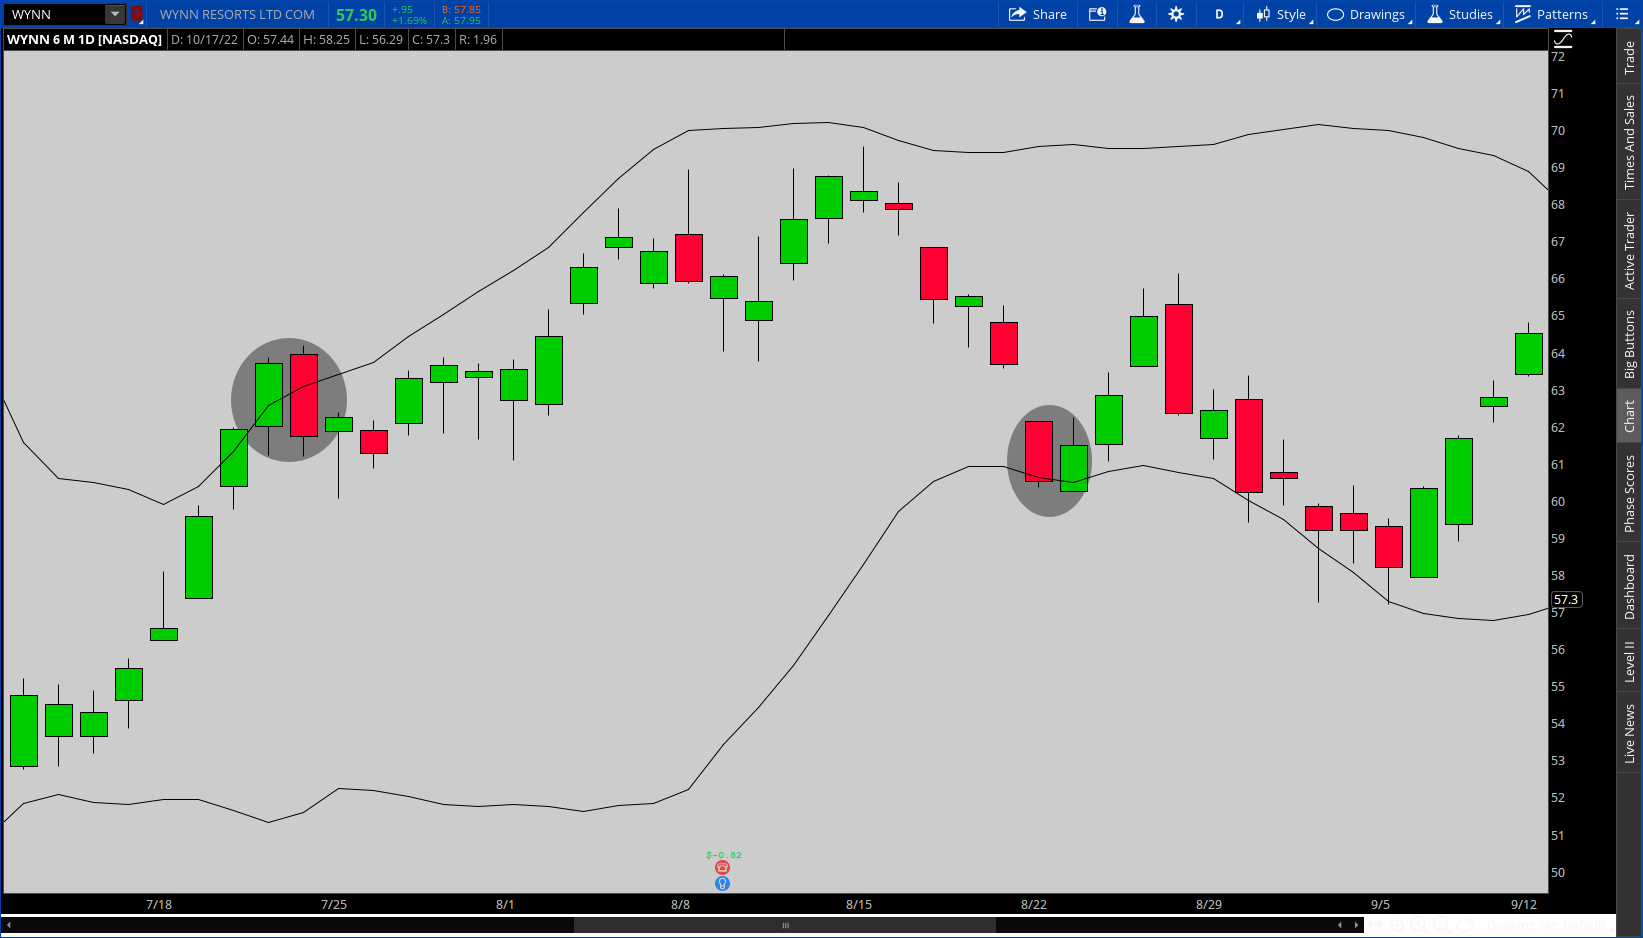
I only get 15 minutes to provide each free solution in this forum. So I don't have time to complete everything you requested. Screenshots below shows the four conditions required to build the signal for the upper band. Each screenshot is named according to which condition is displayed. There are four conditions total for this two bar pattern. I tested it using the example you provided in your screenshot and it marks the second bar that closes back below the upper Bollinger band. Here is the code which was generated from those four conditions:
You can copy/paste that code into the Study filter of your scan. Then you can edit the conditions to see the setting on your own computer. The scan will pick up stocks which satisfy this condition on the second bar which closes below the upper Bollinger band. I see you asked about the time frame. The time frame is set on the Study Filter itself. The code generated by the Condition Wizard contains no elements which define the time frame is used by the scan. If you are not sure how to adjust the time frame for the Study Filter of a scan I suggest you take some time to learn how to use the scan tool on Thinkorswim: https://www.hahn-tech.com/thinkorswim-scans-beginner-to-advanced/
Attachments:
Marked as spam
Answered on October 18, 2022 2:48 pm
|