Scan for gap down within the last week


Category:
0
0

Is it possible to do a scan for stocks that have a gap down within the last week?

Bob

Editor’s note, the title of this question and it’s URL have been updated to more accurately reflect the context of the post.

Marked as spam
Posted by (Questions: 2, Answers: 0)
Asked on May 29, 2017 8:07 am
677 views
0
Private answer

This is quite a complex task and the solution may be beyond the scope of what I would cover in the Q&A forum. Before even attempting this I will need a lot more details.

  1. Does the size of the gap matter? (is one penny sufficient)
  2. If a gap occurred 3 days ago, does the scan have to check if that gap has been closed already?
  3. Does it count if the gap has partially closed? If so, by how much?
  4. What is a gap? Are we comparing previous low to current high or something else?

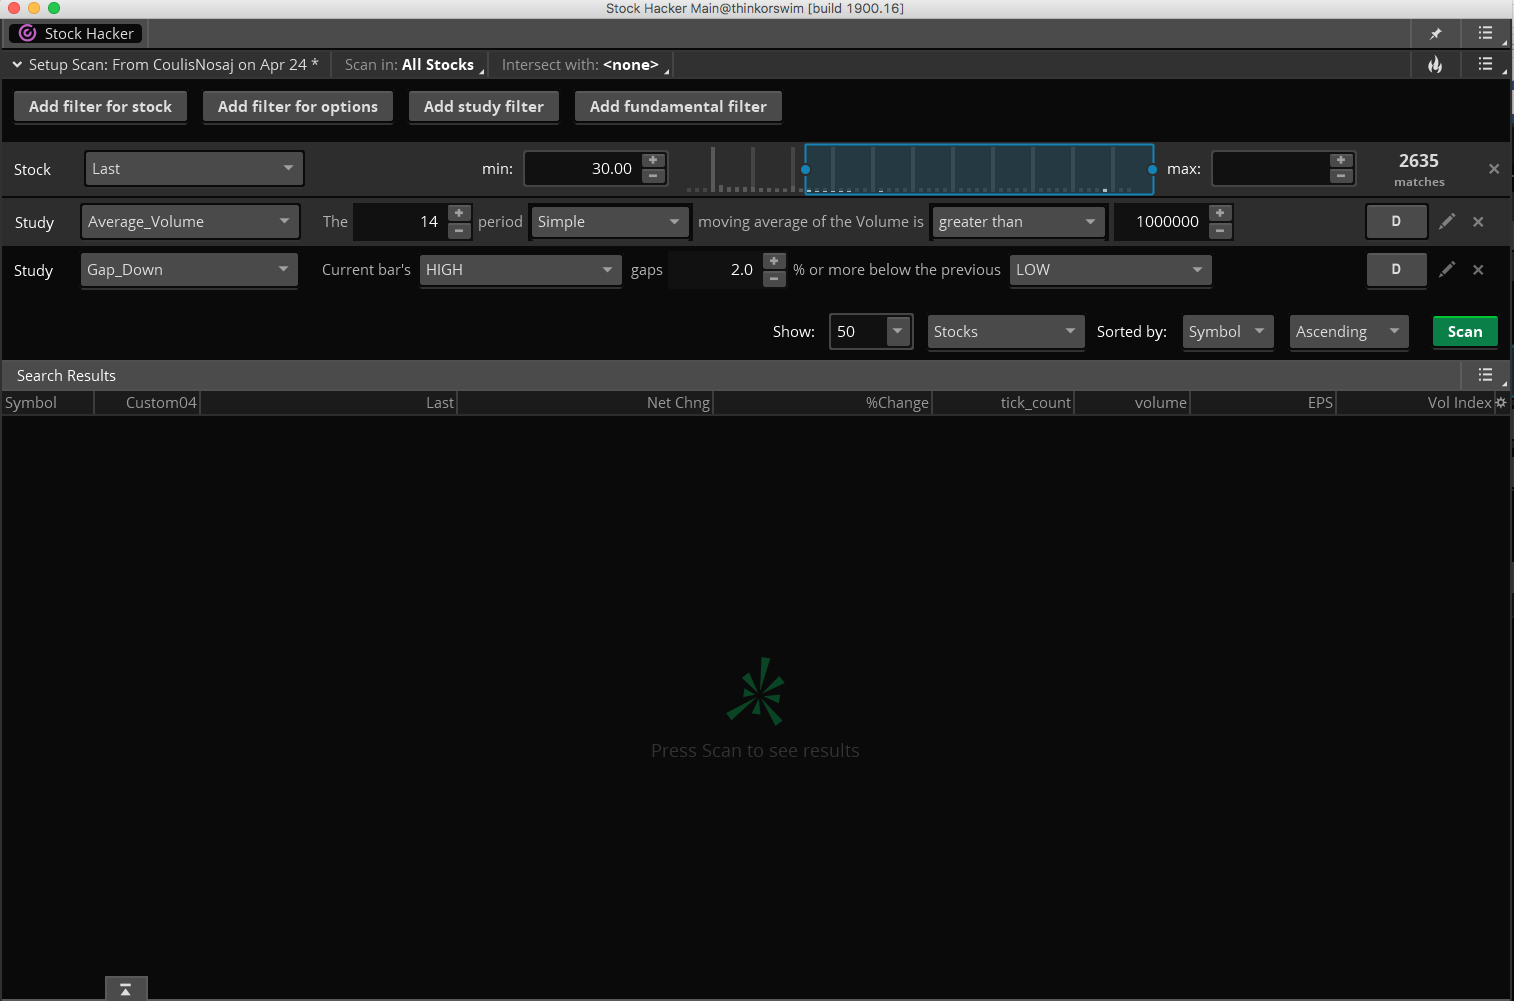
And even after answering these questions there are bound to be more that creep up later. Perhaps you can check out this post and see if the Gap Up from Previous Close can be modified to fit your needs: https://www.hahn-tech.com/ans/gap-to-previous-day-close-scan/

As seen in the screenshot below. Thinkorswim already has a built in filter for Gap_Down. We can adapt that code to include five daily bars. But the code will not perform any of the tasks listed in the bullet points above, except for item 1.

input price1 = high;
input percentage = 2.0;
input price2 = low;
def x = 1-percentage/100;
def term = x*price2[1];
def gapOne = price1 <= term;
def gapTwo = price1[1] <= term[1];
def gapThree = price1[2] <= term[2];
def gapFour = price1[3] <= term[3];
def gapFive = price1[4] <= term[4];
plot scan = gapOne or gapTwo or gapThree or gapFour or gapFive;

Attachments:
Marked as spam
Posted by (Questions: 37, Answers: 4086)
Answered on May 29, 2017 10:58 am