| ♥ 0 |
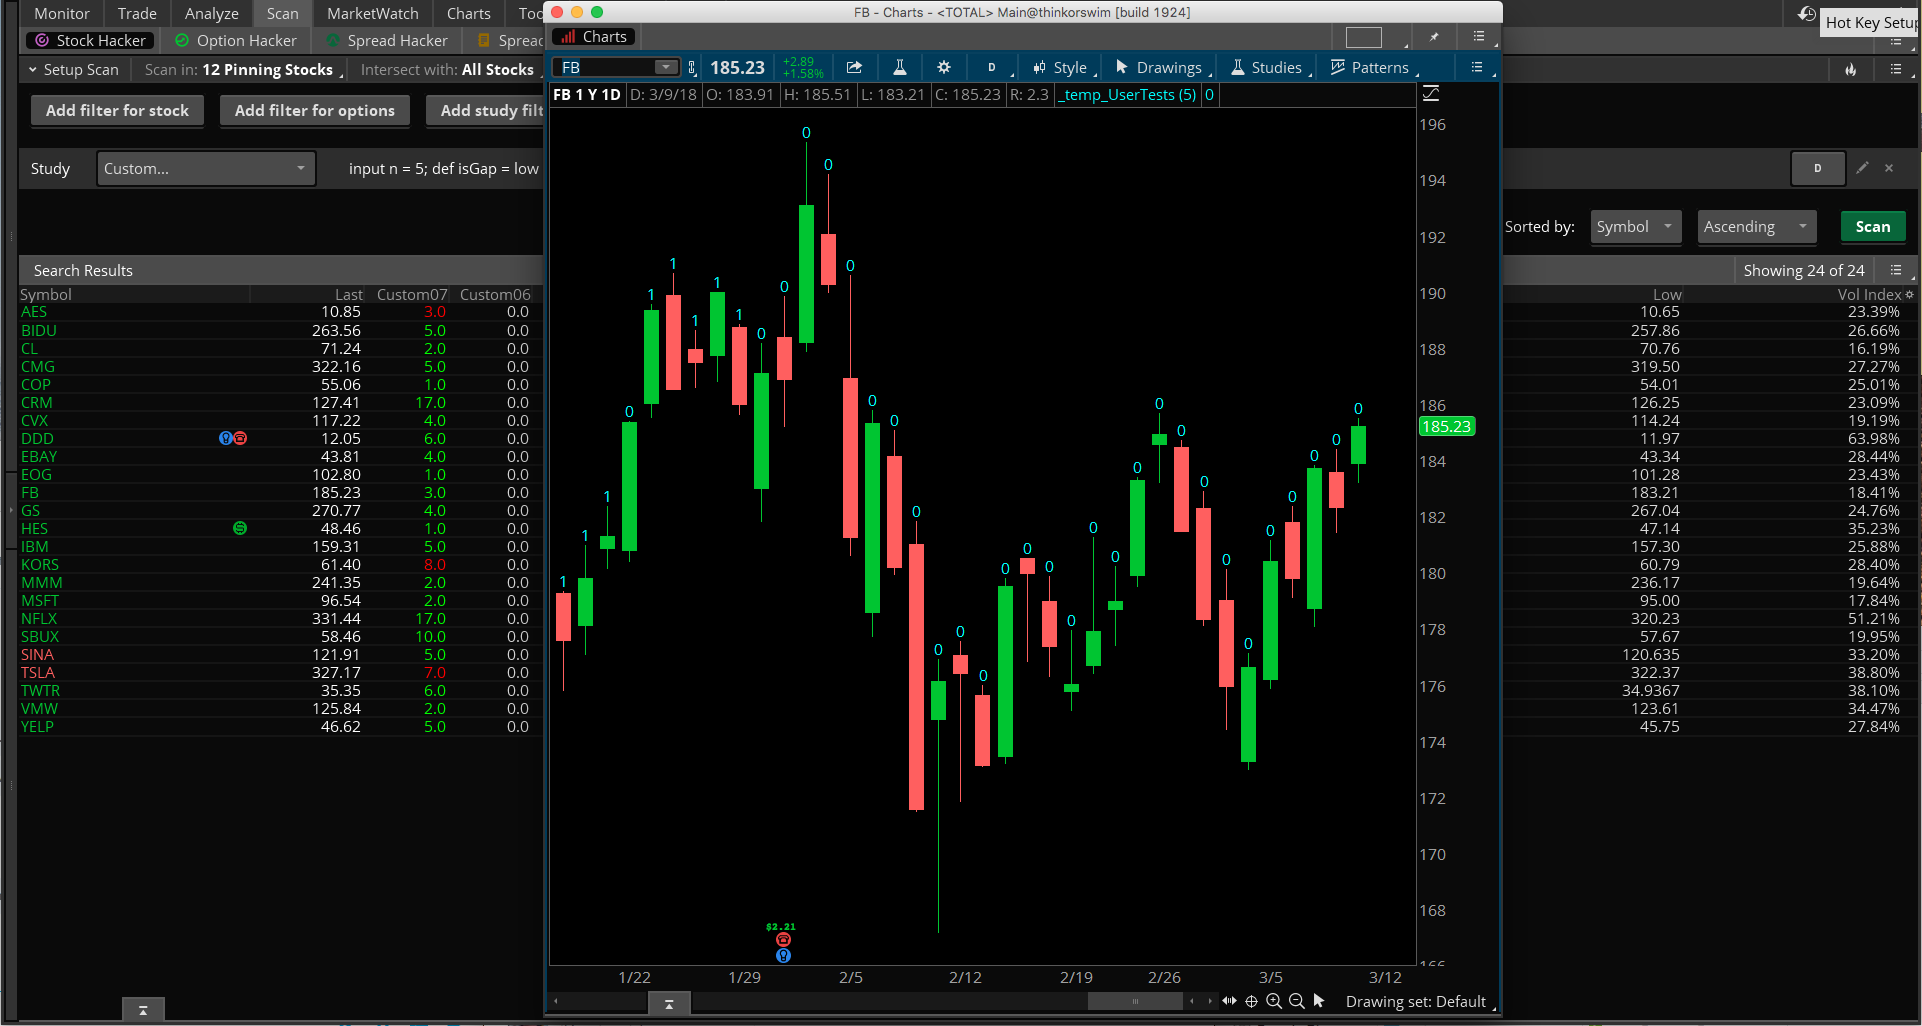
I am looking to create a scan that finds stocks with NO gaps for ALL N bars back. It’s easy enough for me to finds gaps looking N bars back. There are built-in default scans that do this. It seems much harder to create a scan to find NO gaps for ALL N bars back. Any ideas? Someone posted code for an study that works great on a chart. In theory it should work in a scan too. But it does not for some reason. On a chart there is a a number (greater than 0) over the last bar if there were gaps in the last N bars. If there were NO gaps in the last N bars there would be a 0 over the last bar. It works great on a chart. In a scan I have tried “data is greater than 0” to find gaps in last N bars. This is only for testing the scan. As I mentioned above, there are built-in default scans that finds gaps N bars back. This scan finds nothing. I tried “data is equal to 0” to find NO gaps in the last N bars. This scan finds nothing. For some reason, “data” never really seems to be an actual number (0 or greater) when used in a scan, even though the code will plot a 0 or greater number over the last bar. It’s probably something simple that I am missing. -Charles Code provided: def gaps = if isnan(close[-1]) && !isnan(close[0]) then plot data = gaps; RESOLVED
Marked as spam
Asked on March 11, 2018 7:27 am
135 views
|
PERFECT!!! Thank you!