| ♥ 0 |
Hello, Would it be possible to scan using StandardErrorChannel(code below)? I am trying to scan if price(close) just crossed above the plot LowerBand on 5 min time frame? input price = close; def regression; plot UpperBand = regression + standardErrors * stdError; Thanks in advance! MD
Marked as spam
Asked on June 1, 2019 4:53 pm
867 views
|
|
Private answer
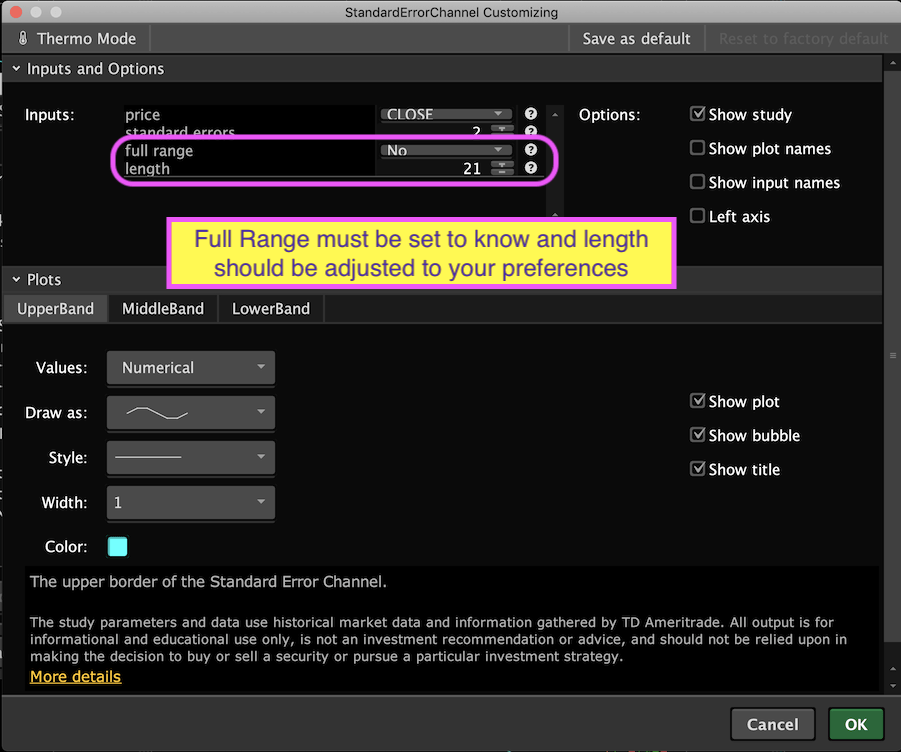
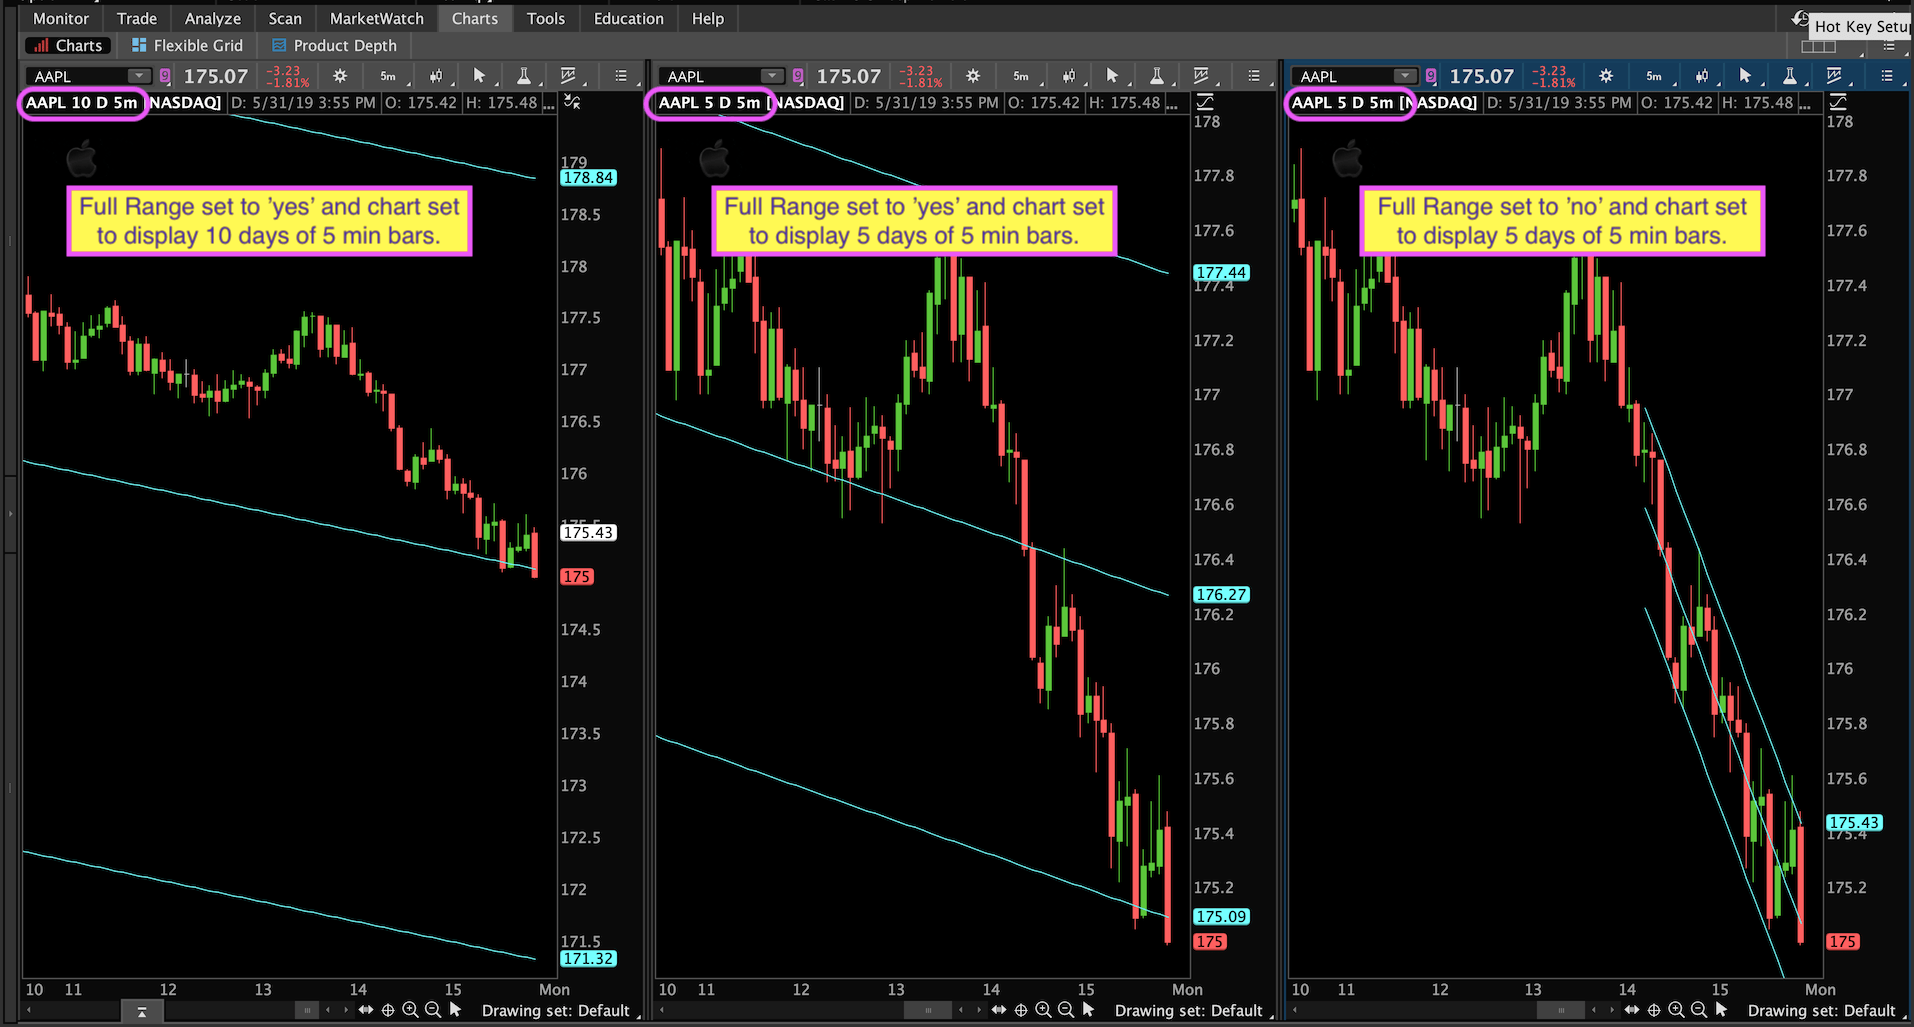
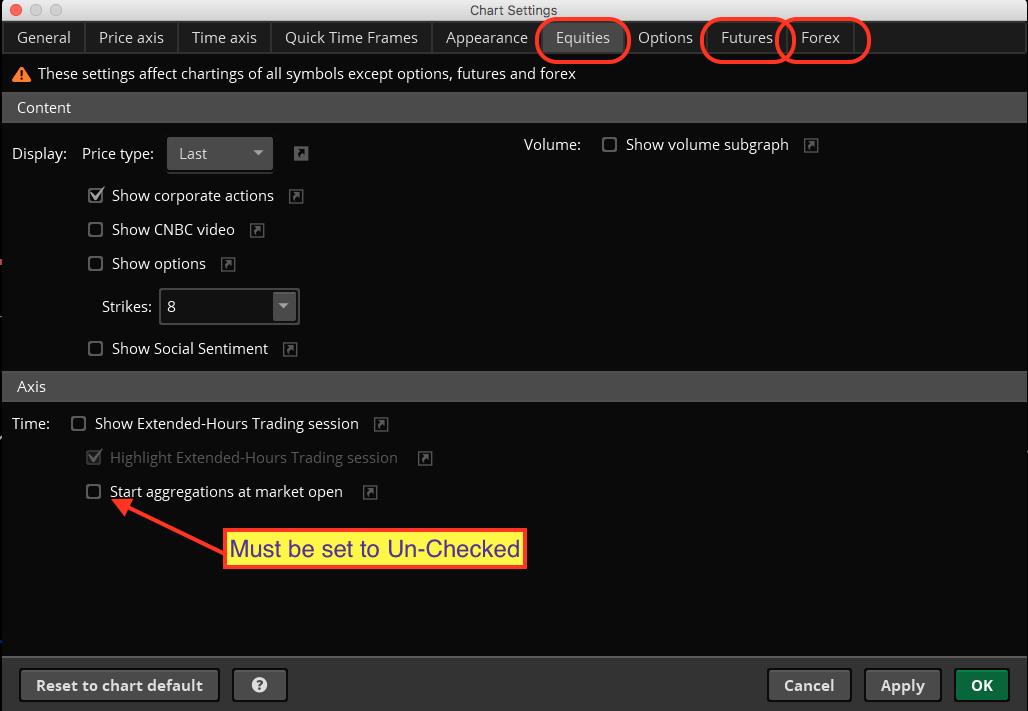
Similar requests have already been posted here and the solution requires a clear understanding of how the historical chart data differs between the scan engine and what you see on the charts. The Screenshots:I have included a couple screenshots to help explain things. First is the chart settings. If you apply this study to a chart and do not change anything you get default settings. Which means the "full range" input is set to 'yes'. This causes the channels to be computed using the entire viewable area of the chart. This default setting is NOT compatible with building a scan. Why? Notice the three charts on the second screenshot. Comments are included to explain the differences between each. Notice the huge difference for the values and plots of the channel on each chart. A Couple of Lessons:So the first lesson is this: The "full range" setting for this indicator MUST BE SET TO 'no'. This means BOTH the chart and the Scan must be set to "full range" == 'no'. Otherwise you will never get the scan to produce results you can see on the charts. The next bit of information you need to understand is how much historical data the scan engine uses. When I use the term 'historical data", consider this equivalent to the viewable area of the chart. For those details, read the section at the bottom of this webpage under the heading: Data Limitations http://toslc.thinkorswim.com/center/howToTos/thinkManual/Scan/Stock-Hacker/studyfilters.html Application:So for the 5 min time frame we find that we only have 15 days (that's calendar days). Which roughly works out to 11 trading days. When we set the "full range" input to 'no' we need to make sure the "length" input does not exceed 11 trading days worth of whatever intraday time frame you have selected. For example at the 30 min time frame we have 13 bars per day (regular session hours). We take 13 times 11 to compute the maximum value we can use for the "length" input when applying the 30 min time frame. That figure is 143. If you exceed this, the channels cannot be computed by the scan engine and this will produce results that cannot be replicated on the charts. And you thought the code part of this question was the real challenge. Bet you didn't have a clue you had to learn all this new stuff before the scan could be put to use. But Wait, There's More:Oh, and there is one more thing. Your chart must be set to NOT start aggregation at market open. That is the third and final screenshot. The scan engine uses data that has this setting 'unchecked'. However your charts use a default value of 'checked'. So check your chart settings before posting a question asking why the results still don't match. The Code:Now for the code. Guess what? It only requires one additional line of code:
That's it. Oh, we do need to turn off the other plots in the study. Scans will only permit one plot. I do this by simply changing the bands from 'plot' to 'def'. And we also need to change the "full range" setting to a default value of 'no'. (that's line 3 of the code below). Be sure to adjust the "length" input to whatever suits your preferences.
Attachments:
Marked as spam
Answered on June 2, 2019 8:55 am
|
Well I don’t have any solution for you. Works on mine except for that one time frame. There is nothing at all wrong with the code and nothing I can suggest to try differently.