Scanning based on strategy


Category:
0
0

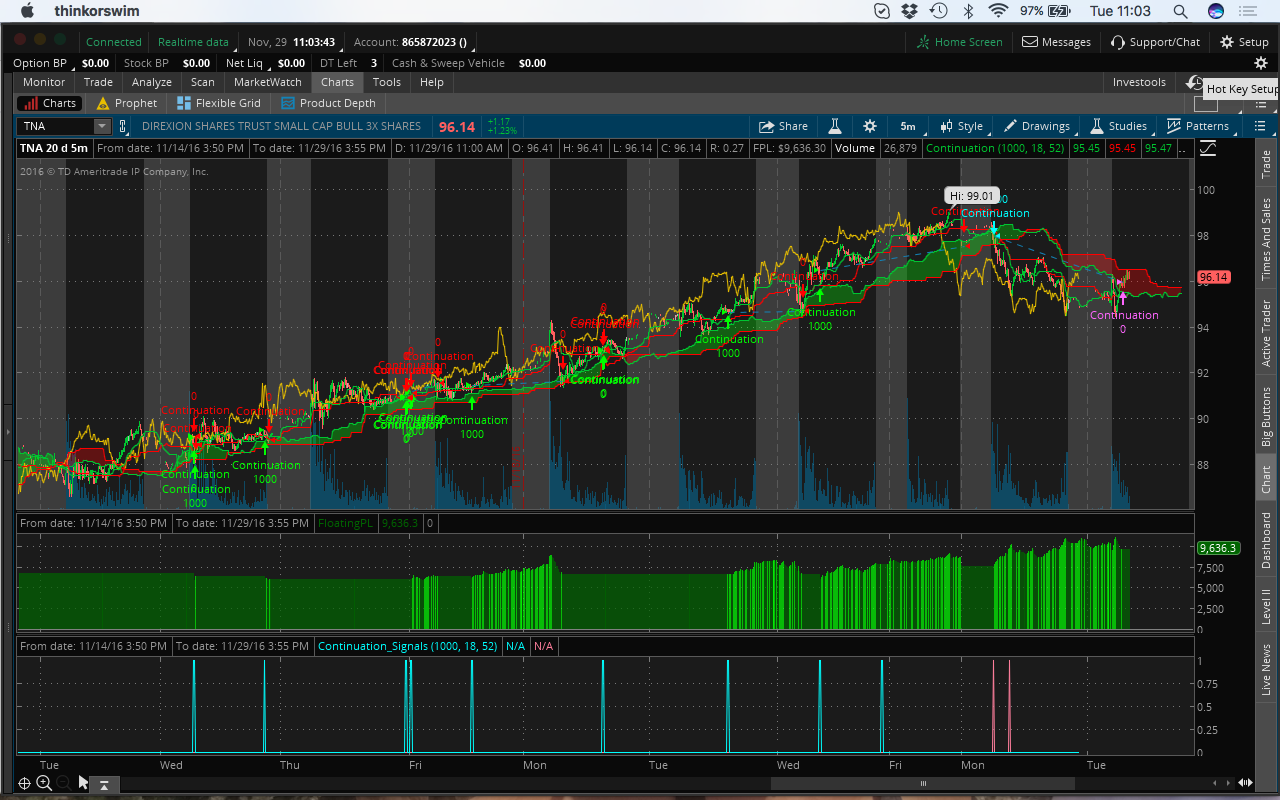
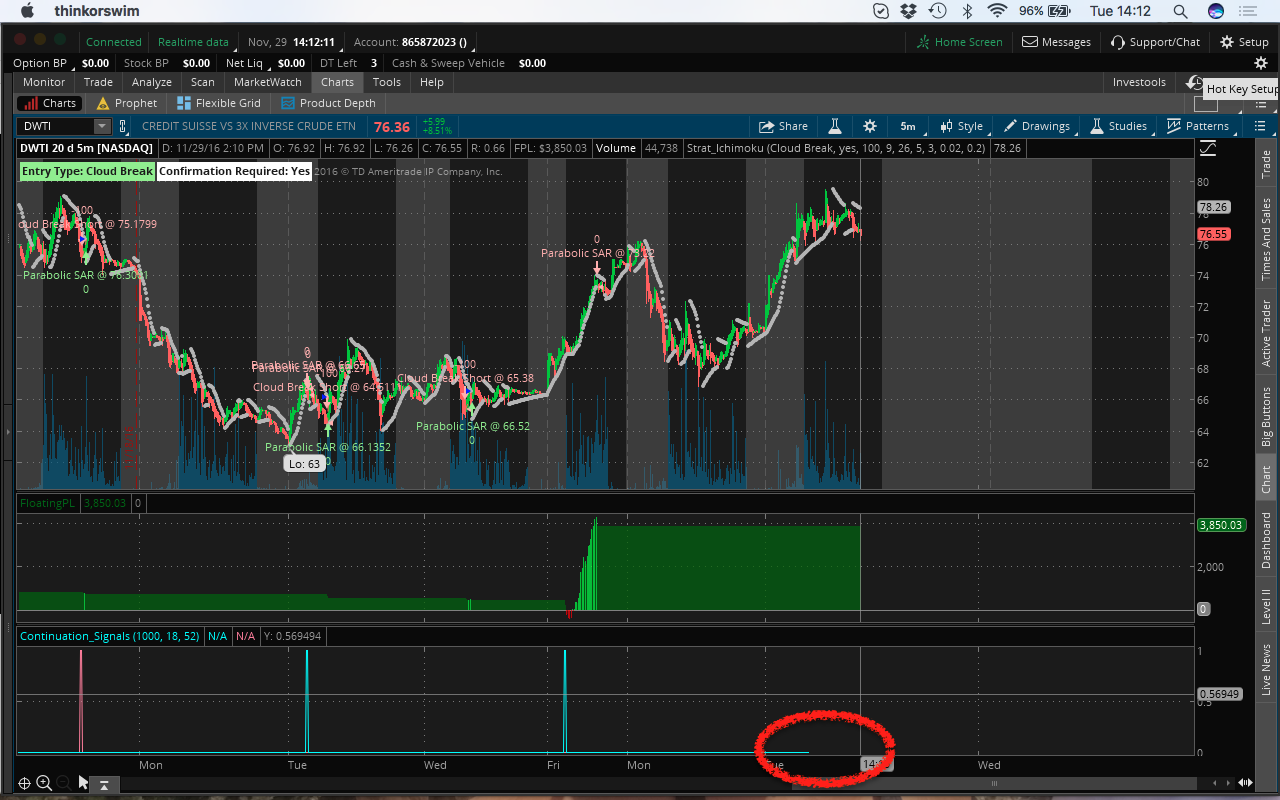
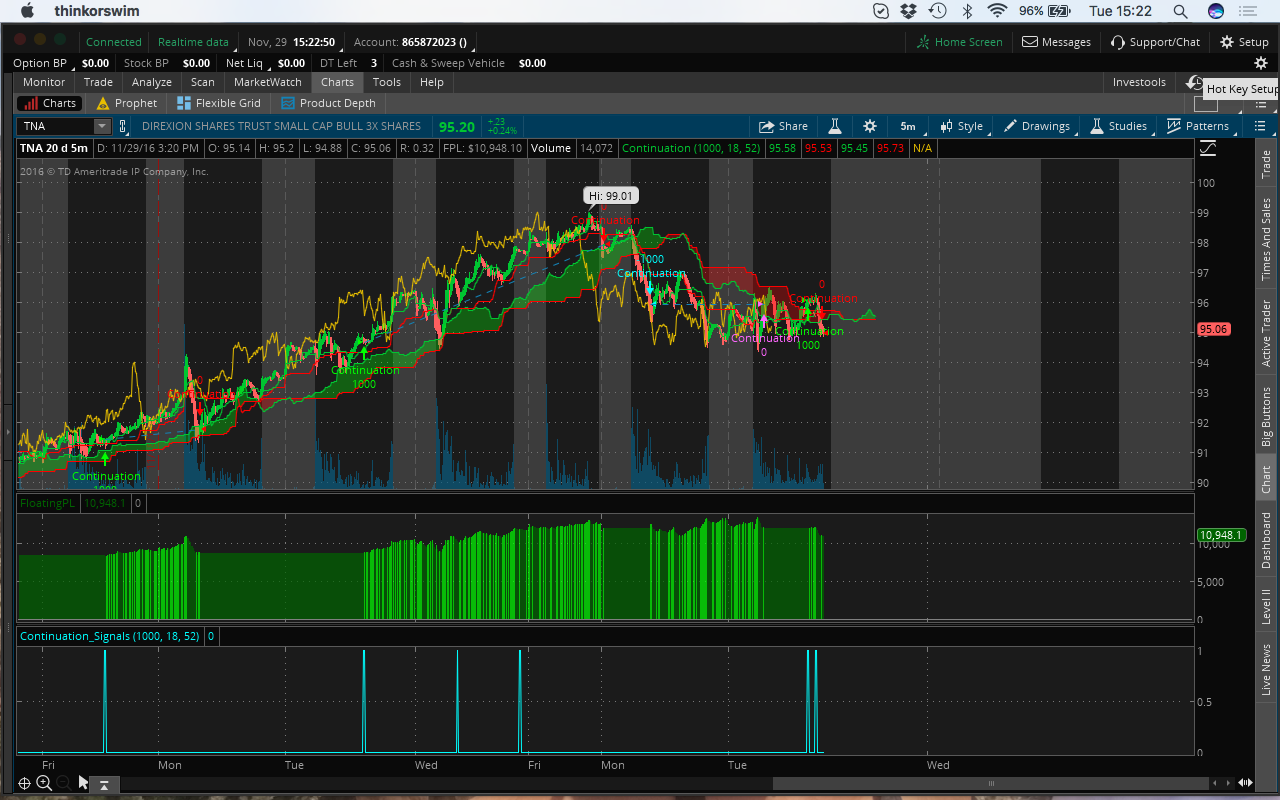
Hello!

(apologies to bother again with a question but I guess other people might have run in this issue)

I created a strategy based on the Ichimoku cloud system (the strategy is a continuation pattern). Then, I created a study based on the strategy (thanks again a million for your videos!). The study (see below the code) plots the entry (long and short) signals of the strategy and seems to work fine (I attach a screenshot in which you can see that the study “Continuation_Signals” seems to work fine). However, when I scan for stocks using this study as a filter the platform is unable to find a single ticker.

The question is: does this happen because the study is too complicated? In case, is there a way to deal with this?

Thanks again!!
R.

—– STUDY CODE —–

declare lower;

input tradeSize = 1000;

input tenkan_period = 18;
input kijun_period = 52;

def Tenkan = (Highest(high, tenkan_period) + Lowest(low, tenkan_period)) / 2;
def Kijun = (Highest(high, kijun_period) + Lowest(low, kijun_period)) / 2;
def “Span A” = (Tenkan[kijun_period] + Kijun[kijun_period]) / 2;
def “Span B” = (Highest(high[kijun_period], 2 * kijun_period) + Lowest(low[kijun_period], 2 * kijun_period)) / 2;
def Chikou = close[-kijun_period];

def SpanASpanB_diff = “Span A” – “Span B”;

def SpanASpanB_diff_lag = SpanASpanB_diff[-kijun_period];

def entry_long = Chikou is greater than close and Tenkan crosses above Kijun within 2 bars and SpanASpanB_diff_lag is greater than 0 and open is greater than Kijun;

def entry_short = Chikou is less than close and Tenkan crosses below Kijun within 2 bars and SpanASpanB_diff_lag is less than 0 and open is less than Kijun;

plot data1 = entry_long;
plot data2 = entry_short;

Attachments:
Marked as spam
Posted by (Questions: 7, Answers: 6)
Asked on November 29, 2016 9:09 am
516 views
2
Private answer

Please don’t apologize for asking the question. That’s the whole reason I added the forum. This is is a very good question because it allows me the opportunity to express some very important concepts in regards to building trading Strategies. The first problem in your code is when you try to test for:

Chikou is greater than close 

The issue here is that Chikou is the close. It is the close shifted backwards the number of bars defined by the input parameter “kijun_period”. So you are trying to measure the current bar’s close to the value of the close 26 bars INTO THE FUTURE.

This is the first important concept in backtesting strategies. You need to avoid “Leaks into the Future”. You see your strategy only provide signals when you can know what the value of the close will be 26 bars into the future. Since this is not possible, the strategy becomes untradeable. It looks great on a historical chart, where it is easy to view future bars from way back in the past.

This is the second important concept. If the strategy produces profits that are too good to be true, it probably is.

One of the red flags for Future Leaks is when you see a ‘-‘ sign used with brackets ‘[]’. The minus sign causes the code to read future bars. For example here is another line of code that is likely a future leak (although I didn’t test it):

def SpanASpanB_diff_lag = SpanASpanB_diff[-kijun_period];

You see that minus sign in front of ‘kijun_period’? That line of code is reading future bars. If you try to use it to generate signals you will have a future leak and the signals will be reproducible on a live chart.

Hope this helps you understand why the scans came up empty. The scans can’t read the future any better than we can.

Marked as spam
Posted by (Questions: 37, Answers: 4079)
Answered on November 29, 2016 12:04 pm
1
Private answer

It seems to me this latest version does not contain any future leaks. I see that you shift the reference of Span A minus Span B backward so that you can read the value that is already projected forward from known historical information. So that is ok. And I see you made a significant change in your use of the Chikou line which also removes the future leak that was previously present.

I wanted to point out you do have a small bit of redundancy there.

These two lines effectively cancel out, you end up with a value of the current bar’s close:
def Chikou = close[-kijun_period];
def Chikou_forward = Chikou[kijun_period];

And the one labeled “close_forward” is actually reading the close 52 bars in the past:
def close_forward = close[kijun_period];

All very minor except for the readability aspect. By the time these variables are used in your entry signal:
def entry_long = Chikou_forward > close_forward

You are essentially comparing the current close (Chikou_forward) to the close from 52 bars ago (close_forward). So you could write it like this:

def entry_long = close > close[kijun_period]...

But it now works, which is the main goal. Great job. And you see in that first screen shot that your signal line did not extend all the way to the current bar at the far right side of the chart. That is the evidence your previous code had leaks into the future. It appears to be corrected. Be sure to up-vote the answer(s) which were most helpful in solving your issue.

Marked as spam
Posted by (Questions: 37, Answers: 4079)
Answered on November 29, 2016 2:37 pm
0
Private answer

Hi Pete!
First of all, thanks for your very nice message.
Second, can I disagree? : )

Let me explain. Let’s start from one important point. I agree that backtesting is risky because you might use information not available in real time. However, the advantage of the Ichimoku system is that it projects two lines (the Span A and the Span B – therefore the entire cloud) into the future. And once they are determined, they do not change. That’s why you can see the cloud *forward* with respect to the current price at any given point in time.

In other words, at any given point in time “t”, you are already sure what the could will look like at time “t+kijun_period” because you can already see it. Do we agree on this? If so, my code should be ok.

Also, in the meanwhile I think I fixed the scanning issue. The issue (and I think your code might suffer the same issue..) was the Chikou condition. The ToS scanners in fact can only scan given the *current* price. So at time “t” if you scan you can only see stocks meeting the conditions at time “t” (this should be obvious right?). However, if one of the conditions refers to the Chikou the issue is that the Chikou stops “t-kijun_periods” ago so effectively the scanner will *never* be able to scan in real time because it will always miss information. If you’re interested here below you can see a new version of my strategy (and scanning). And in the attached picture you can see that the continuation signal line extends all the way to the last bar (which was not in the previous version of the code). I’m not done yet but imho it is working pretty well (usual disclaimer applies).

Again, I might be wrong in some parts of this code but I’m pretty much sure I’m not assuming anything that the system does not know in real time. Am I wrong?

—– MODIFIED CODE —–

declare lower;

input tradeSize = 1000;

input tenkan_period = 18;
input kijun_period = 52;

def Tenkan = (Highest(high, tenkan_period) + Lowest(low, tenkan_period)) / 2;
def Kijun = (Highest(high, kijun_period) + Lowest(low, kijun_period)) / 2;
def “Span A” = (Tenkan[kijun_period] + Kijun[kijun_period]) / 2;
def “Span B” = (Highest(high[kijun_period], 2 * kijun_period) + Lowest(low[kijun_period], 2 * kijun_period)) / 2;
def Chikou = close[-kijun_period];
def Chikou_forward = Chikou[kijun_period];
def close_forward = close[kijun_period];

def SpanASpanB_diff = “Span A” – “Span B”;

def SpanASpanB_diff_lag = SpanASpanB_diff[-kijun_period];

def entry_long = Chikou_forward > close_forward and Tenkan crosses above Kijun within 2 bars and SpanASpanB_diff_lag > 0 and open > Kijun and open > “Span A” and open[1] > “Span A” and close[1] > “Span A” and low[1] > “Span A”;

#def entry_short = Chikou is less than close and Tenkan crosses below Kijun within 2 bars and SpanASpanB_diff_lag is less than 0 and open is less than Kijun;

plot data1 = entry_long;
#plot data2 = entry_short;

Attachments:
Marked as spam
Posted by (Questions: 7, Answers: 6)
Answered on November 29, 2016 1:38 pm
0
Private answer

Pete,
Thank you VERY MUCH!!

Marked as spam
Posted by (Questions: 7, Answers: 6)
Answered on November 29, 2016 2:39 pm