| ♥ 0 |
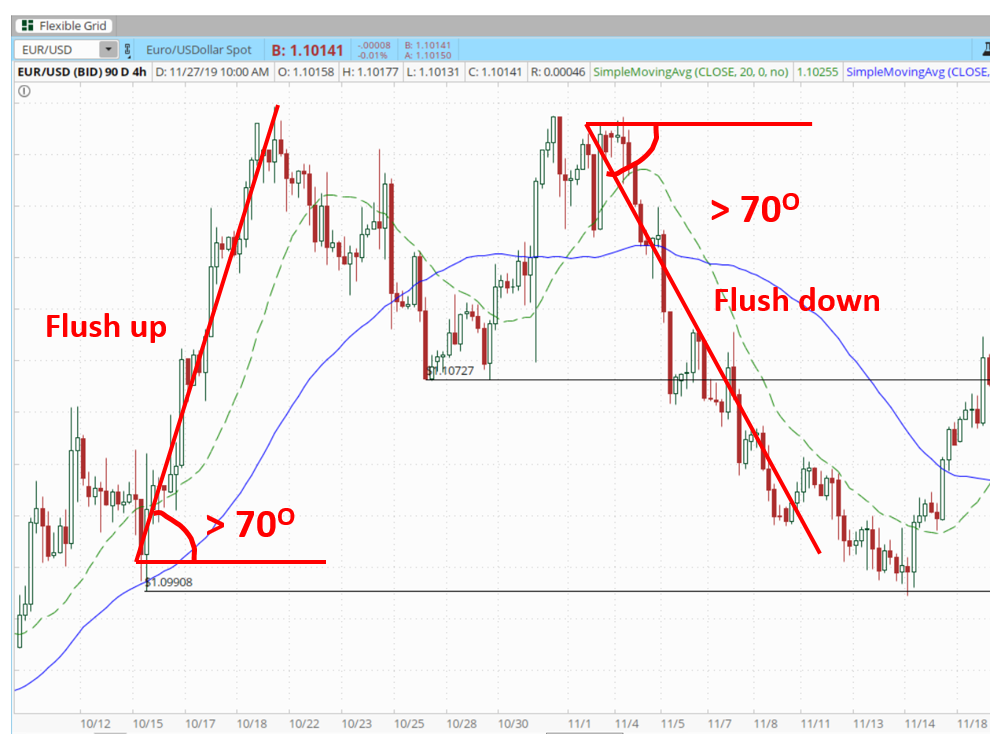
Dear Pete, I wish you can help me to scan for the flush up patterns in the stock market. A flush is when the price moves up > 70 degrees within a timeframe (e.g., 1-day candle in a 3-month timeframe). It usually (not necessarily) consists of a 1 or 2 high momentum bars that are overextended and outstanding. Sometimes, it consists of a series of the normal-range bars but trends up very steeply. That is to say, it is the steepness that defines the flush up patterns. I tried to use ATR and Bollinger band to search for these patterns in thinkorswim. However, the scan results are not very good. I will be very appreciated if you can help. ^_^ Best wishes, Attachments:
Marked as spam
Asked on December 12, 2019 9:15 pm
465 views
|
|
Private answer
Let's see. The very first thing we need to cover is this concept of measuring angles on a chart. I have already covered this in a previous post. Please review that here: https://www.hahn-tech.com/ans/angle-between-k-d/ What you will find is an example screenshot that demonstrates in no uncertain terms that angles do not actually exist on a chart. There is no way to measure a fixed angle on the chart of a trading platform. Completely and utterly impossible. Why? Well it's all explained in the post I just linked above. (HINT: When you zoom the date/time range in and out the angles change!) Ok, so once you grasp that reality the next step you need to accomplish is to revise what you thought was a pattern defined by an angle and find a new way to define it. Some ideas, reversion from the mean, percent change, rise over time.... Once you get that worked out you have to figure out the rest of your specifications. The computer is pure logic. It's either yes or no and nothing in between. The computer can never understand the following terms you used in your specifications:
As you can see from this list of terms used to define your patterns.... there is nothing here that can be measured. Nothing that can be computed mathematically. Nothing that can be defined in a purely logical manner. So if you want to come up with a solution here you need to convert your way of thinking. If it cannot be computed mathematically or defined with a logical yes/no, it does not really exist. (speaking from the perspective or writing code). Speaking from many years of experience. Once you boil this all down to elements that can be written into code you will likely find this pattern has absolutely no value whatsoever in trading. The human eye (and the mind behind it) is very deceptive. We find profitable patterns all over the charts. As we examine these patterns in greater and greater detail, we find more randomness than we ever expected. So far as I have found the only patterns that matter are:
Focus on the transitions from one to the other and there you will find changes in trend direction. Everything else is noise. Marked as spam
Answered on December 13, 2019 10:11 am
|