| ♥ 0 |
How can I change the code on the watchlist code listed below to create two scans, one for above 55 RVI and one for below 45 RVI using in the 2-minute, 5-minute, and 10-minute time frames? Attachments:
Marked as spam
Asked on June 11, 2018 2:20 pm
173 views
|
|
Private answer
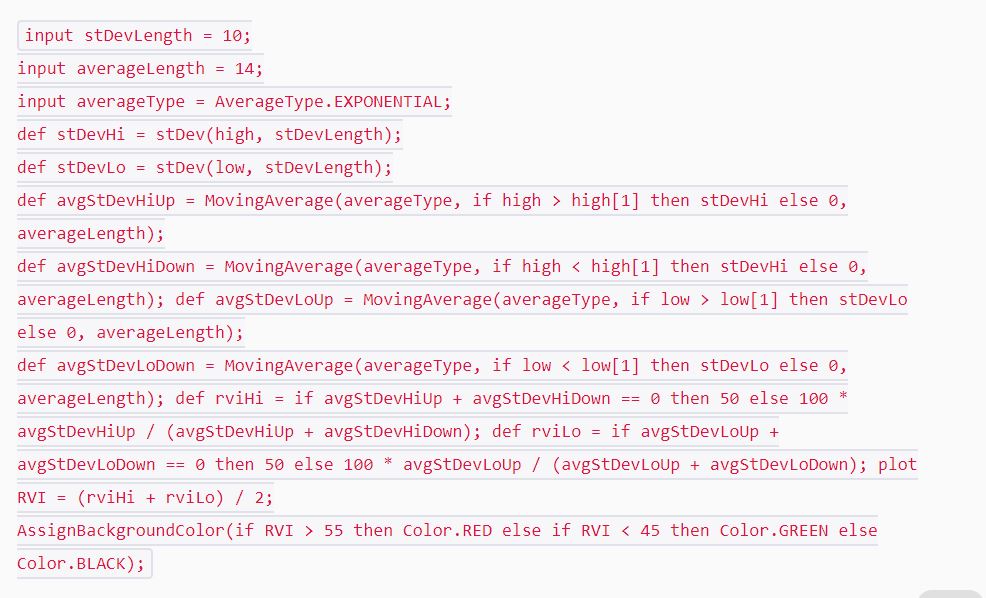
First, let’s tell folks where that piece of code came from: https://www.hahn-tech.com/ans/relative-volatility-index-rvi-custom-watch-list/ We do that because we will only be showing the changes in this post. Go to that previous post to get the rest of the code. First, we delete this line:
Then we change the plot RVI to def RVI:
Then we add the statements used to scan for above 55 and below 45.
You can only run one of these at a time so we comment one of those statements. Just move the ‘#’ symbol to switch between the two scans. Apply these changes and you can use this as a Study Filter for whatever time frame that is supported within the scan environment. Marked as spam
Answered on June 11, 2018 3:43 pm
|