| ♥ 0 |
Can you please help me setup a scanner in TOS that scans for stocks that have 2 consecutive minute bars where RelativeVolumeStdDev for 25 period is greater than equal to 4.0 . My chart is 1min charts. What is difference between length and the aggregation time that can select while setting up query. Are TOS scanners realtime.
Marked as spam
Asked on March 29, 2021 11:34 am
230 views
|
|
Private answer
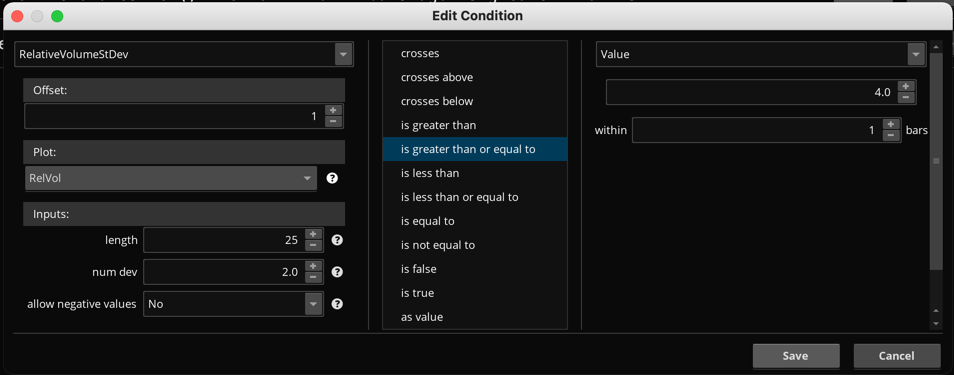
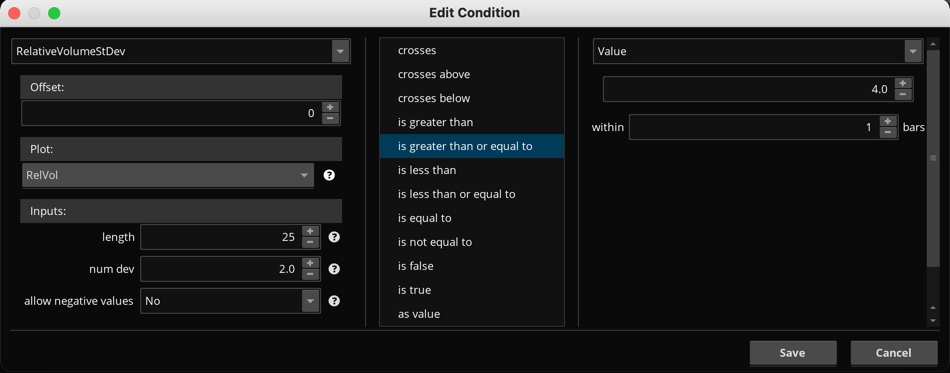
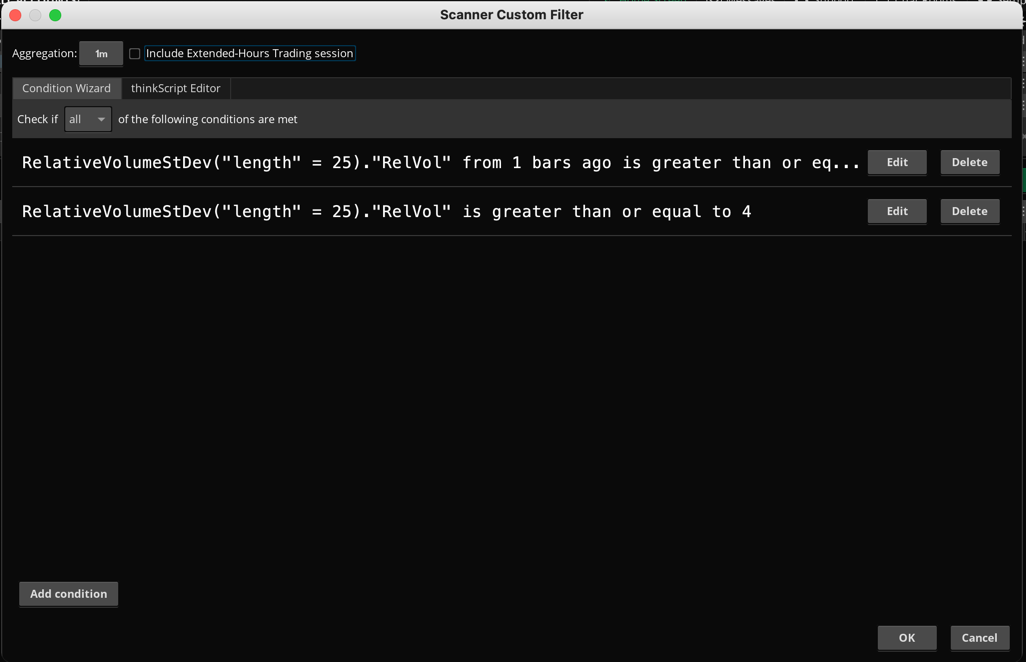
I moved your question out of the "Frequently Asked Questions" topic and into the "Stock Scanners" topic. The scan you have requested can be built without knowing how to write a signal line of code. Just use the Condition Wizard. Haven't heard of this before? Here is a video that explains everything you need to know: https://www.hahn-tech.com/thinkorswim-condition-wizard/ Screenshots below show the steps for creating this scan using the Condition Wizard. Yes, scans on Thinkorswim operate in real time regardless of the time frame selected. However scans on Thinkorswim run server-side so they are subject to delays due to internet connection quality and the current load on their servers. I always advise users of Thinkorswim to avoid using 1 min time frames for custom scans. But for some reason a large number of users think they have to use the 1 min time frame to get the fastest results. The exact opposite is actually true. For scans, you can adjust the length but you can NOT adjust the aggregation period. Secondary aggregation periods are not permitted in the Study Filters of custom scans.
Attachments:
Marked as spam
Answered on March 29, 2021 12:22 pm
|