Show % Change since open, in Column


Category:
0
0

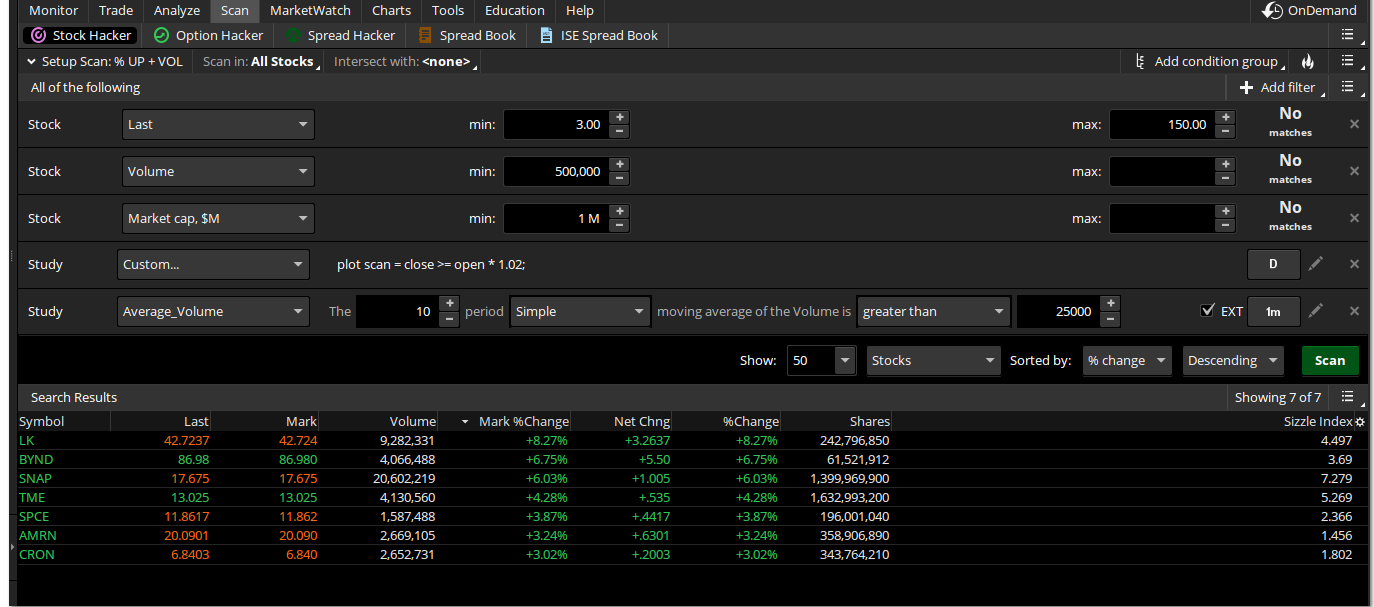
So i have this great scan that you helped me with https://www.hahn-tech.com/ans/percent-change-since-open-scan-tos/   but TOS has no way to show the actual % change since open in the table. TOS only shows % change since yesterdays close, I want to show the same thing the scan plots (% change since open) in the table.

Attachments:
Marked as spam
Posted by (Questions: 3, Answers: 3)
Asked on January 9, 2020 8:49 am
182 views
0
Private answer

What you are requesting here is a custom watchlist column and not a scan. You can display a custom watchlist column in the results section of a scan. But it is still called a custom watchlist column.

plot data = Round(100 * (close / open - 1), 1);

You will set the time frame of the custom watchlist column to daily.

Marked as spam
Posted by (Questions: 37, Answers: 4086)
Answered on January 9, 2020 2:31 pm