Show only alternating plots


Category:
1
0

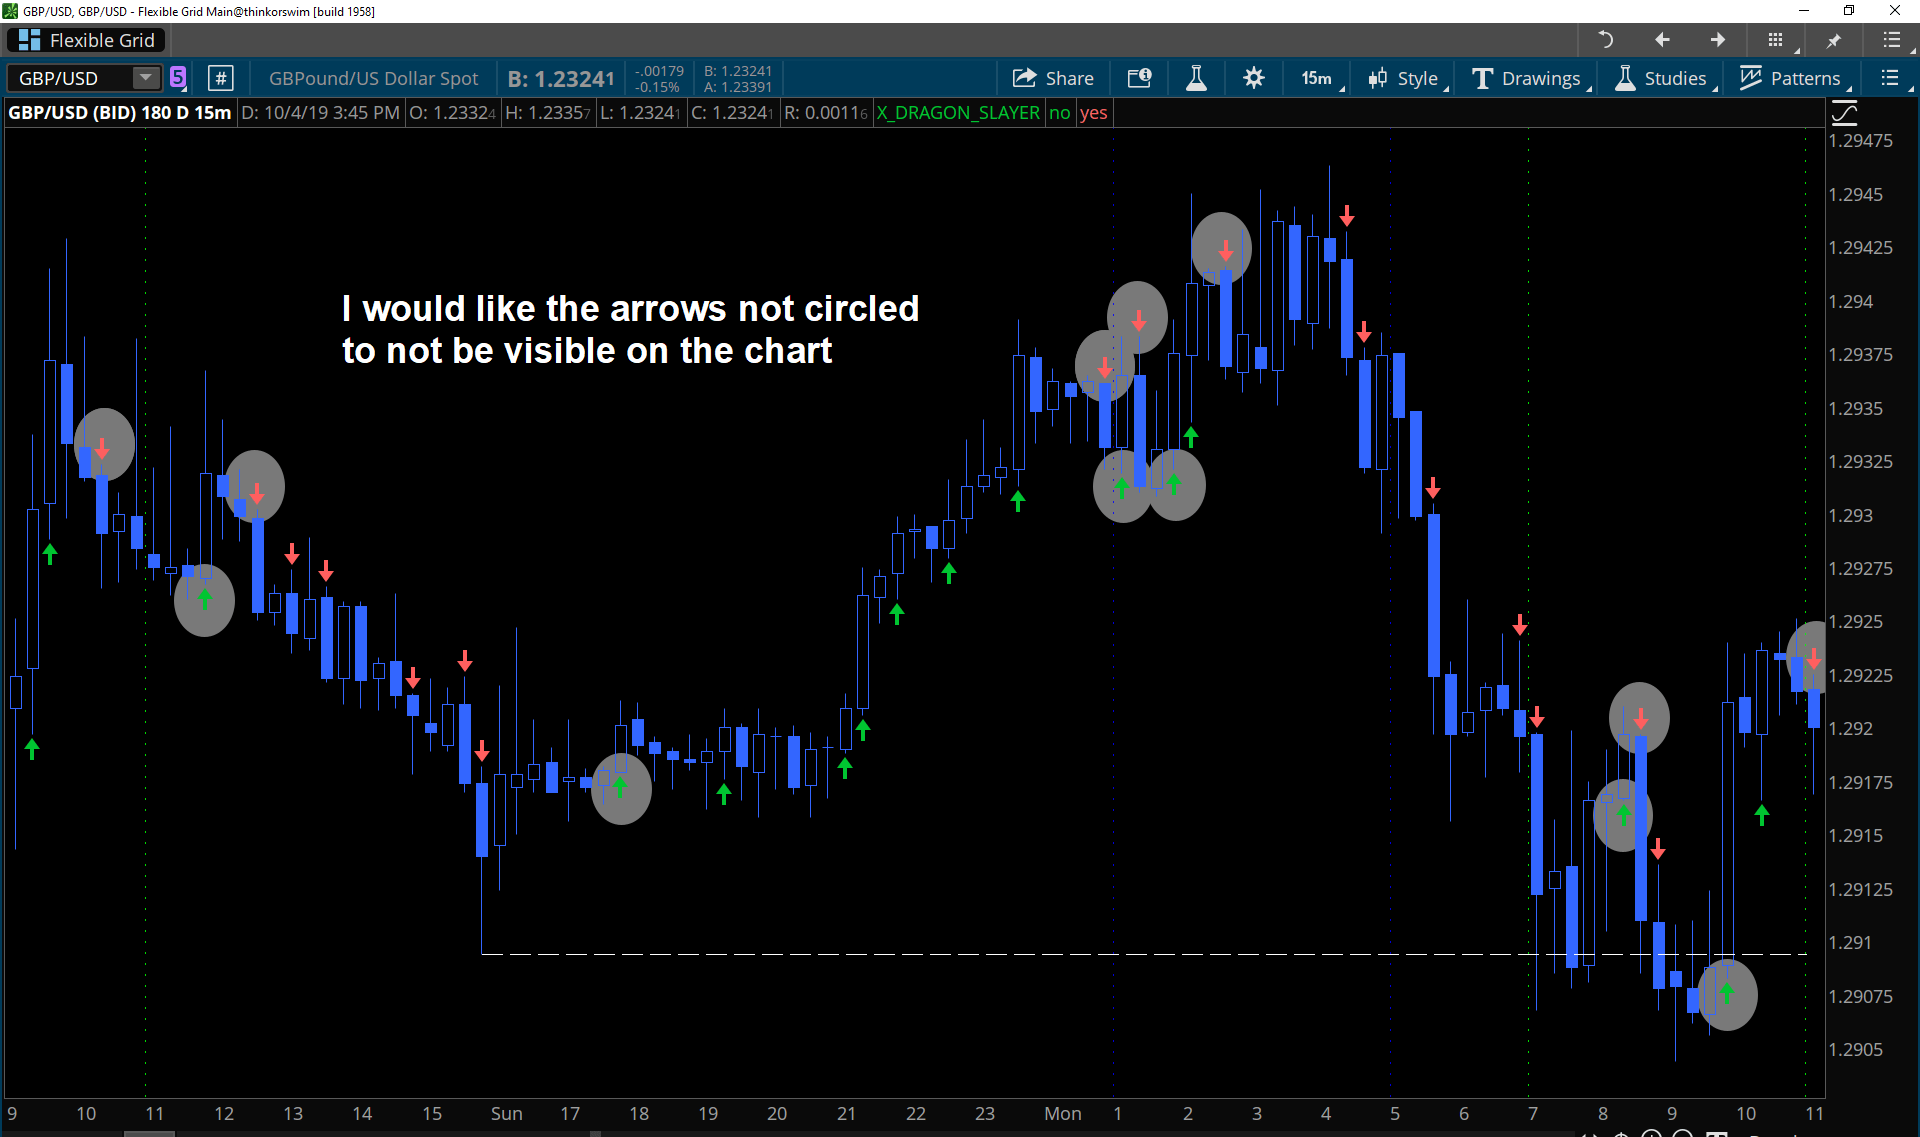
Firstly, a huge thanks to Pete!!!.  Without having any background in writing code, I’ve been writing my own custom, studies, watchlists, strategies, etc  for a couple of years now thanks to the information on this site 🙂  I have a piece of code that has me stumped and I could really use some help.  I’m not 100% sure if its even possible….

def IsUp = close > open;
def IsDown = close < open;
def IsDoji = IsDoji();
def avgRange = 0.05 * Average(high – low, 20);

plot BUY =
((Sum(IsUp, 1)[1] >= 0)) and
IsUp[0] and
Highest(high[1], 1) < close[0];
BUY.SetPaintingStrategy(PaintingStrategy.BOOLEAN_ARROW_UP);
BUY.SetDefaultColor(GetColor(6));

plot SELL =
((Sum(IsUp, 1)[1] >= 0)) and
IsDown[0] and
Lowest(low[1], 1) > close[0];
SELL.SetPaintingStrategy(PaintingStrategy.BOOLEAN_ARROW_DOWN);
SELL.SetDefaultColor(GetColor(5));

#Alert(BUY, “BUY”, Alert.BAR, Sound.DING);
#Alert(SELL, “SELL”, Alert.BAR, Sound.DING);


I would like to only see one arrow plotted when there is a change in direction. Is this possible?  The code plots a lot of arrows that I do not need and the additional arrows that I ignore are just cluttering up my charts.   My OCD is driving me nuts 🙂  Please, any help would be greatly appreciated.  Thanks is advance!


Attachments:
Marked as spam
Posted by (Questions: 1, Answers: 1)
Asked on October 6, 2019 12:52 am
202 views
1
Private answer

I will be the first to tell you that OCD and writing code do not mix. So the very first step is to reduce your code to the minimum number of elements that achieves the same result.

def isUp = close > open;
def isDown = close < open;
plot buy = isUp and high[1] < close; buy.SetPaintingStrategy(PaintingStrategy.BOOLEAN_ARROW_UP); buy.SetDefaultColor(GetColor(6));
plot sell = isDown and low[1] > close;
sell.SetPaintingStrategy(PaintingStrategy.BOOLEAN_ARROW_DOWN);
sell.SetDefaultColor(GetColor(5));

And in case you don't believe that this cut down and minimized version of your code produces the same results, see the first screenshot below. On the left is your code and on right is this minimized version.

If you struggle to understand how this produces the same results as yours then post a separate question asking for the explanation. At this point I will proceed with the minimized version of the code and remove those repeating up and down arrows.

We must use recursion in order to keep track of the most recent signal. Recursion means the code assigns a value to a variable using its own value from a previous bar on the chart. Using recursion is pretty common. But it's a bit complex to implement. This is going to be much more complex because we need to keep track of both signals within the same variable.

Here is your new code, adapted to prevent the same signal repeating until an opposing signal presents. I added a couple of comment lines to explain the changes.

def isUp = close > open;
def isDown = close < open;
# create variables to hold the values previously used for plotting arrows
def buySignal = isUp and high[1] < close; def sellSignal = isDown and low[1] > close;
# use recursive variable to keep track of the most recent raw signal
rec trackLastSignal = if buySignal then 1 else if sellSignal then -1 else trackLastSignal[1];
# next, check the value of the tracking variable to filter buy and sell signals
plot buy = trackLastSignal[1] == -1 and buySignal;
buy.SetPaintingStrategy(PaintingStrategy.BOOLEAN_ARROW_UP);
buy.SetDefaultColor(GetColor(6));
plot sell = trackLastSignal[1] == 1 and sellSignal;
sell.SetPaintingStrategy(PaintingStrategy.BOOLEAN_ARROW_DOWN);
sell.SetDefaultColor(GetColor(5));

Second screenshot below shows the results.

Attachments:
Marked as spam
Posted by (Questions: 37, Answers: 4079)
Answered on October 6, 2019 1:47 pm
1
Thanks Pete! I really appreciate your quick response. Not only have you solved my problem but you have taught me something that I will be able to implement in other studies. THANKS :)
( at October 6, 2019 2:06 pm)