| ♥ 0 |
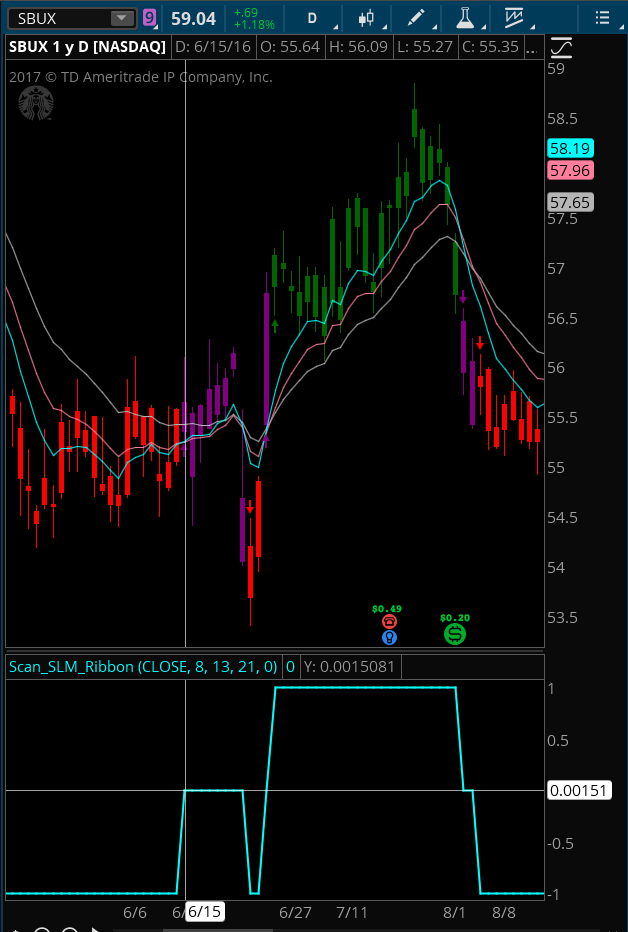
Hi Pete From your code for the Slim scan, is it possible to include the purple condition also when performing a momentum up scan? Doing this would include stocks that are presently consolidating or forming a base in the context of an up trend. Please see screenshot
Thanks Attachments:
Marked as spam
Asked on April 19, 2017 12:01 pm
777 views
|
|
Private answer
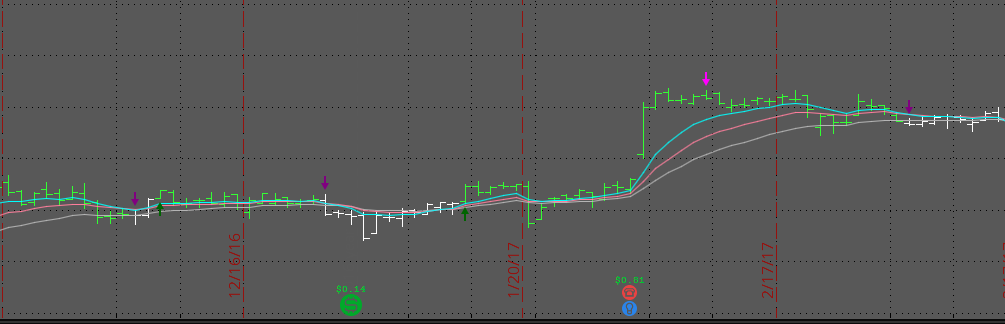
First let’s make sure future visitors of this post understand the context. Here is a link to the video showing the scan for SLM Ribbons: https://www.hahn-tech.com/thinkorswim-scan-slm-ribbons/ I will not repeat the entire code here, to save space. What I post here assumes you already have the code provided in that video I linked above. To scan for the “purple conditions” which is momentum neutral. You can use the following:
But that will not differentiate between a consolidation in an uptrend from a consolidation in a downtrend. You could scan for the very first bar of neutral momentum, while at the same time check if the previous bar was an uptrend or downtrend.
This would capture the first neutral bar following an uptrend. The opposite signal could be found like this.
I have included a screenshot with the scan plotted as a lower subgraph. This will help you see how the value of the Colorbars variable changes as the color of the candles change. Don’t forget to up-vote any question that best solves your question! Attachments:
Marked as spam
Answered on April 19, 2017 3:36 pm
|
|
|
Private answer
Thanks Pete to try to clarify my question. I think I word it incorrectly. I guess the question was If is possible to use the code to scan for both the green and purple condition at the same time, or a scan that eliminates any stock that fulfill the red condition but show stocks currently in any of the other two stages green and purple. Therefore is it possible to add the code that you provided above to the code for the green condition and the scan would look up for stocks that are either in a green or purple stage in the same scan? Hopefully that is not too confusing. Thank you Pete Marked as spam
Answered on April 19, 2017 4:35 pm
|
|
|
Private answer
Thanks Pete I am sorry I missed the prior explanation. Regards Marked as spam
Answered on April 20, 2017 9:35 am
|
Ok, this should have been clear from the way I stepped through the code examples. But I will try to explain it another way. Colorbars has three possible values. (refer to the screenshot I provided earlier)
It can be 1 (Green Bars)
It can be 0 (Purple Bars)
It can be -1 (Red Bars)
So scan for whatever combination you want. Here is how you would scan for both green and purple bars at the same time.
plot scan = Colorbars == 1 or Colorbars == 0;