stop plots from continuing after last bar


Category:
0
0

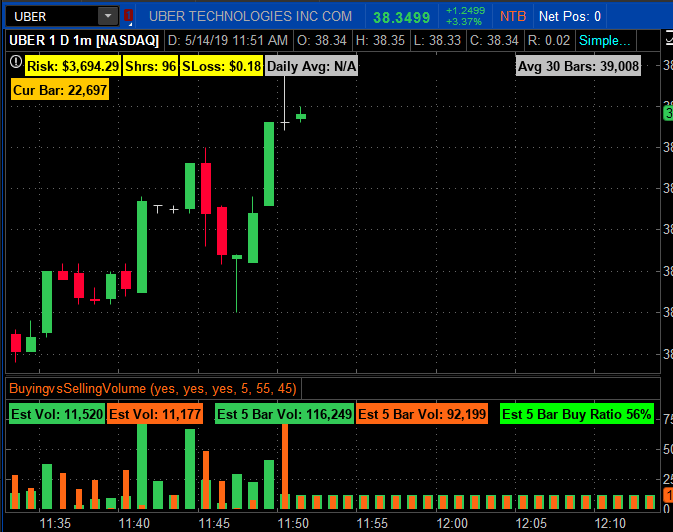
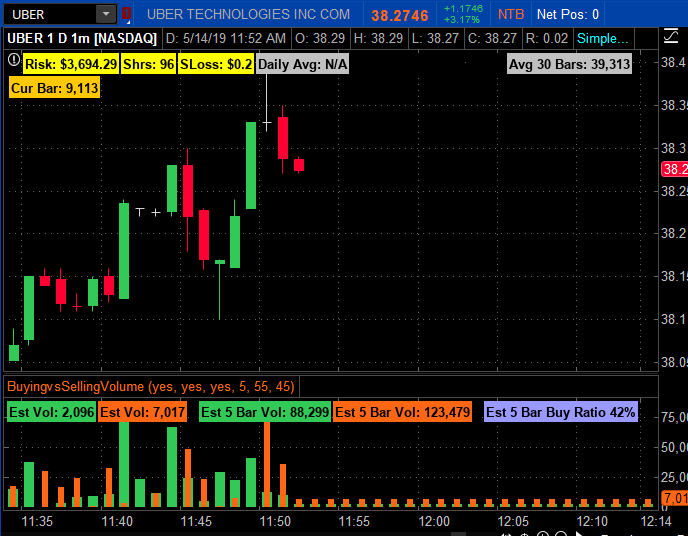
I have the script attached and basically it should have relative comment lines in it for you.  It\’s an attempt to get as good as it can get using the TOS data block feeds to determine the amt of buy volume versus sell volume.  It\’s my code btw.

The issue is that the histogram  where the labels show up and the relative volume related bars are showing the future!  Yes that\’s right, apparently oracle code, pun intended.  It should be showing the latest bar as it fluxuates with incoming volume and price changes and the bars that come after this current aggregation ie. future shouldn\’t be showing at all.  Something is causing future bars that haven\’t happened yet to be replicated starting with the current bar.

By the way, after the current bar is done, ie. on 1 min chart, one minute has elapsed.  That bar looks fine, now it displays the next minute bar and many future bars, all identical and the height of them all change based on trades/vol etc.

I\’d attach a video of it in operation but since I can\’t, I\’ll send the code and two captured images one as a before pick and one after.  Look for the differences in the bars and notice bars there in the future instead of stopping at the latest current bar.

I hope you have a clue, i\’m no expert.  Other than this issue all else seems to work ok.

I appreciate what you do and hope you can help!

Best,

Alan

Marked as spam
Posted by (Questions: 5, Answers: 1)
Asked on May 14, 2019 9:56 am
366 views
0
Private answer

First, a quick lesson on posting in a forum. When you enter a title for your question, consider it like the subject line of an email. It should be brief. Between 6-8 words. At the same time it should clearly describe the context of your question. Here is the title you entered:

strange result of a volume type script I wrote, I'm wondering if you can see the cause, it

From the details you included I see you have a plot that repeats the value of the last bar into the right expansion area of the chart. Given this context, I have changed the title of this post so other viewers seeking a similar solution are able to search for and find it.

Now, on to the solution. I found the following lines of code that may cause this problem:

def Buying = if (isNan(isBuyNan), Buying[1],Round(V*(C-L)/(H-L)));
def Selling = if (isNan(isSellNan), Selling[1],Round( V*(H-C)/(H-L)));

Both lines of code are doing the same thing for opposite sides of your study. So let's just examine the first line, the second line will be resolved in a similar fashion. I see that you are using a test for NaN: IsNaN(isBuyNan)

And when the value of isBuyNan is not a number (NaN), then you recursively capture the previous bar's value for the variable named Buying. Every column on the chart where bars are present, isBuyNan will be a number.

So where on the chart do we find that isBuyNan is equal to NaN? For every column AFTER the last bar on the chart, isBuyNan will equal NaN. The net result of this is that your code is purposely repeating the value from the last bar on the chart into those columns on the right where isBuyNan is equal to NaN.

This gives us the solution to your problem:

def Buying = Round(V * (C - L) / (H - L));

Just apply a similar fix to the Selling variable.

Last note, there was a typo in your code. The plot names do not match the style names. As shown here:

# Selling Volume
Plot SellVol = Selling;
SV.setPaintingStrategy(PaintingStrategy.Histogram);
SV.SetDefaultColor(Color.downtick);
SV.HideTitle();
SV.HideBubble();
SV.SetLineWeight(4);

# Buying Volume
# Note that Selling + Buying Volume will equal Volume.
Plot BuyVol = Buying;
BV.setPaintingStrategy(PaintingStrategy.Histogram);
BV.SetDefaultColor(Color.uptick);
BV.HideTitle();
BV.HideBubble();
BV.SetLineWeight(4);

This needs to be corrected because it creates an error and the code cannot be applied to the chart until it is fixed. As shown here:

# Selling Volume
Plot SellVol = Selling;
SellVol.setPaintingStrategy(PaintingStrategy.Histogram);
SellVol.SetDefaultColor(Color.downtick);
SellVol.HideTitle();
SellVol.HideBubble();
SellVol.SetLineWeight(4);

# Buying Volume
# Note that Selling + Buying Volume will equal Volume.
Plot BuyVol = Buying;
BuyVol.setPaintingStrategy(PaintingStrategy.Histogram);
BuyVol.SetDefaultColor(Color.uptick);
BuyVol.HideTitle();
BuyVol.HideBubble();
BuyVol.SetLineWeight(4);

Marked as spam
Posted by (Questions: 37, Answers: 4079)
Answered on May 16, 2019 3:40 pm
0
Hi Pete, Thanks for the response info, and you're right my title was somewhat cryptic. I will ensure my future entries are titled better. Starting with your latter type remarks, sorry about that, when i edited and copied you the code, for some reason I changed the plot names from SV and BV to SellVol and BuyVol without change the rest of the lines. The actual code was correct before i sent to you. Ok, now for your first point regarding using: def Buying = Round(V * (C - L) / (H - L)); instead of what i used: def Buying = if (isNan(isBuyNan), Buying[1],Round(V*(C-L)/(H-L))); I actually used the code that you provided originally but what i was seeing in the Est Vol labels was that sometimes they were displaying N/A. Now that I could probably live with but as you see in the code, there are a few places where I was doing a sum function on the buying and selling. It was my understanding that if the TOS platform data came in with a NAN that it would cause the sum function to return a NAN. Example: If I summed 5 values, 4 of which were valid numbers with a fifth that came in as a NAN, I'd end up with a label that show'd N/A. AND it would show N/A until 5 consecutive good values (ie. not nan) were received. Thus my getting the last five valid number would be thrown off, who knows how many nans in a row the data would retrieve in a row and I'd have lost the last valid sum value. In otherwards, say i got numbers 1,2,3,4,5, sum would be 15. Next came nan, the sum would be nan, now if the next number that came in was 7, wouldn't it be a condition of sum(2,3,4,5,nan,7) which would result in a nan? wouldn't this continue until the nan had shifted left out of the history? So I guess, in reality how do I prevent the sum lines i use for cumulative values from including any nan in the last xxx number of values? Oh, I hope i didn't over explain this to you or even under explain it. input CumulativeBars = 10; AddLabel(ShowCumulativeBars, "Est " + CumulativeBars + " Bar Vol: "+ Round(Sum(Buying,CumulativeBars),0), Color.uptick);
( at May 17, 2019 5:04 am)
0

There should never be a case where you have a candle on the chart for which the following equation equals Double.NaN:


def isBuyNan = (C-L)/(H-L);
def isSellNan = (H-C)/(H-L);

But if you still have concerns then you can apply a completely different solution. Revert to your original code and instead of making the changes I suggested in my answer, change your plot statements to:

plot SellVol = if !IsNaN(close) then Selling else Double.NaN;
plot BuyVol = if !IsNaN(close) then Buying else Double.NaN;

( at May 17, 2019 8:41 am)
0
Thanks Pete, Now when you posted your latest solution I have to admit I did a slap to my forehead, :) Of course! Once again, thank you much! All is working now.
( at May 22, 2019 5:00 am)