| ♥ 0 |
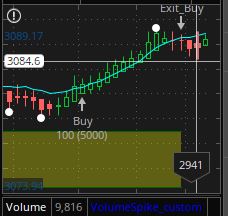
Hi All, Need help in the thinkscript code below. I’m trying to code a backtesting strategy on /ES mini, where when the Heikin Ashi candle closes above TEMA line, it should trigger buy order and once the Heikin Ashi candle closes below the TEMA, it should exit buy. Something like the attached image. The chart settings are /ES 1000 Tick chart with Heinkin Ashi candles and TEMA 30 The below code gives me the Entry and Exit as attached image but doesn’t give any values in the report, also attached image. Any help appreciated. Thanks. def HAclose = ohlc4; def crossover= if HAclose > TEMA30 and HAclose [1] < TEMA30 [1] then 1 else 0; def trigger=if crossover then 1 else 0; AddOrder(OrderType.BUY_TO_OPEN, trigger, 1 AddOrder(OrderType.SELL_TO_CLOSE, HAclose < TEMA30 and HAclose[1] > TEMA30[1], 1, tickColor = GetColor(2), arrowColor = GetColor(3), name = “Exit_Buy”); Attachments:
RESOLVED
Marked as spam
Asked on November 11, 2019 1:59 pm
811 views
|

|
Private answer
I had to update the title of your question so that everyone else would know the context of your question and be able to find it in the search results. The original question title was "Thinkscript Heinken Ashi candle" and it told us absolutely nothing about the topic of your question. Now on to the solution. I think it will help if you read up on how to apply the AddOrder statement. We have several videos on this topic which would have helped you avoid the mistake you made in your code. But here are the full details straight from the developers at Thinkorswim: https://toslc.thinkorswim.com/center/reference/thinkScript/Functions/Others/AddOrder.html Reading from that page, we find the third parameter of this function contains the price at which the theoretical trades are executed. In your original code the third parameter contains a value of 1. Which is why your chart does not show the dashed lines connecting each buy and sell order on the chart. Because the buy and sells are all taking place at $1.00. This is also the reason why your report is showing zero profit. Because you are executing every order at one dollar. Here is your corrected code that will record the buys and sells at the open of the bar that follows the bar that crosses.
In closing. I will mention that there is very little reason for using a triple exponential moving average. Especially with a length of 30. Why? I wrote an entire article on the topic so you can find the answers here: https://www.hahn-tech.com/moving-averages-exponential-problems/ Marked as spam
Answered on November 12, 2019 1:29 pm
|