Strategy using TTM Squeeze


0
0

Back again Pete. This time i would ask you to write me a simple STRATEGY with the following criteria.
Using TTM Squeeze, only the HISTOGRAM

Buy to open at the close on the histogram bar that closes up thru 0.
Sell at the close to close on the SECOND BLUE BAR or
user defined profit target and stop loss.
Sell to open on the histogram bar that crosses below 0
Buy to close on the second yellow bar or
user defined profit target and stop loss

As always thanks for the work you do, i will be glad to make another contribution.

PS…its really difficult to find the part of your site.  It always takes me a while.

Marked as spam
Posted by (Questions: 10, Answers: 11)
Asked on June 10, 2017 2:32 pm
2425 views
0

Strategies can be very complicated to write. Your entry and exit based solely on the Histogram of the TTM Squeeze is relatively easy to write. When you add the specification ”or user defined profit target and stop”. That is when this becomes a project subject to our standard fees. You can view our rates and fill out the form to initiate a request for a custom thinkscript project using this link: https://www.hahn-tech.com/about/

I would like to know how you eventually find you way to the Q&A Forum. You say it always takes you a while. There is a direct link to the Q&A Forum included in the main menu, between Home and Free Tutorials. I am interested to hear any suggestions on how to make it easier to locate.

( at June 10, 2017 5:07 pm)
0

Thanks Pete, dont mean for that to be time consuming, leave off the user entered targets and stops and just do the squeeze histogram.
I found the link you were referring to , guess i was just overlooking it. Thanks.

( at June 12, 2017 3:20 pm)
0
Private answer

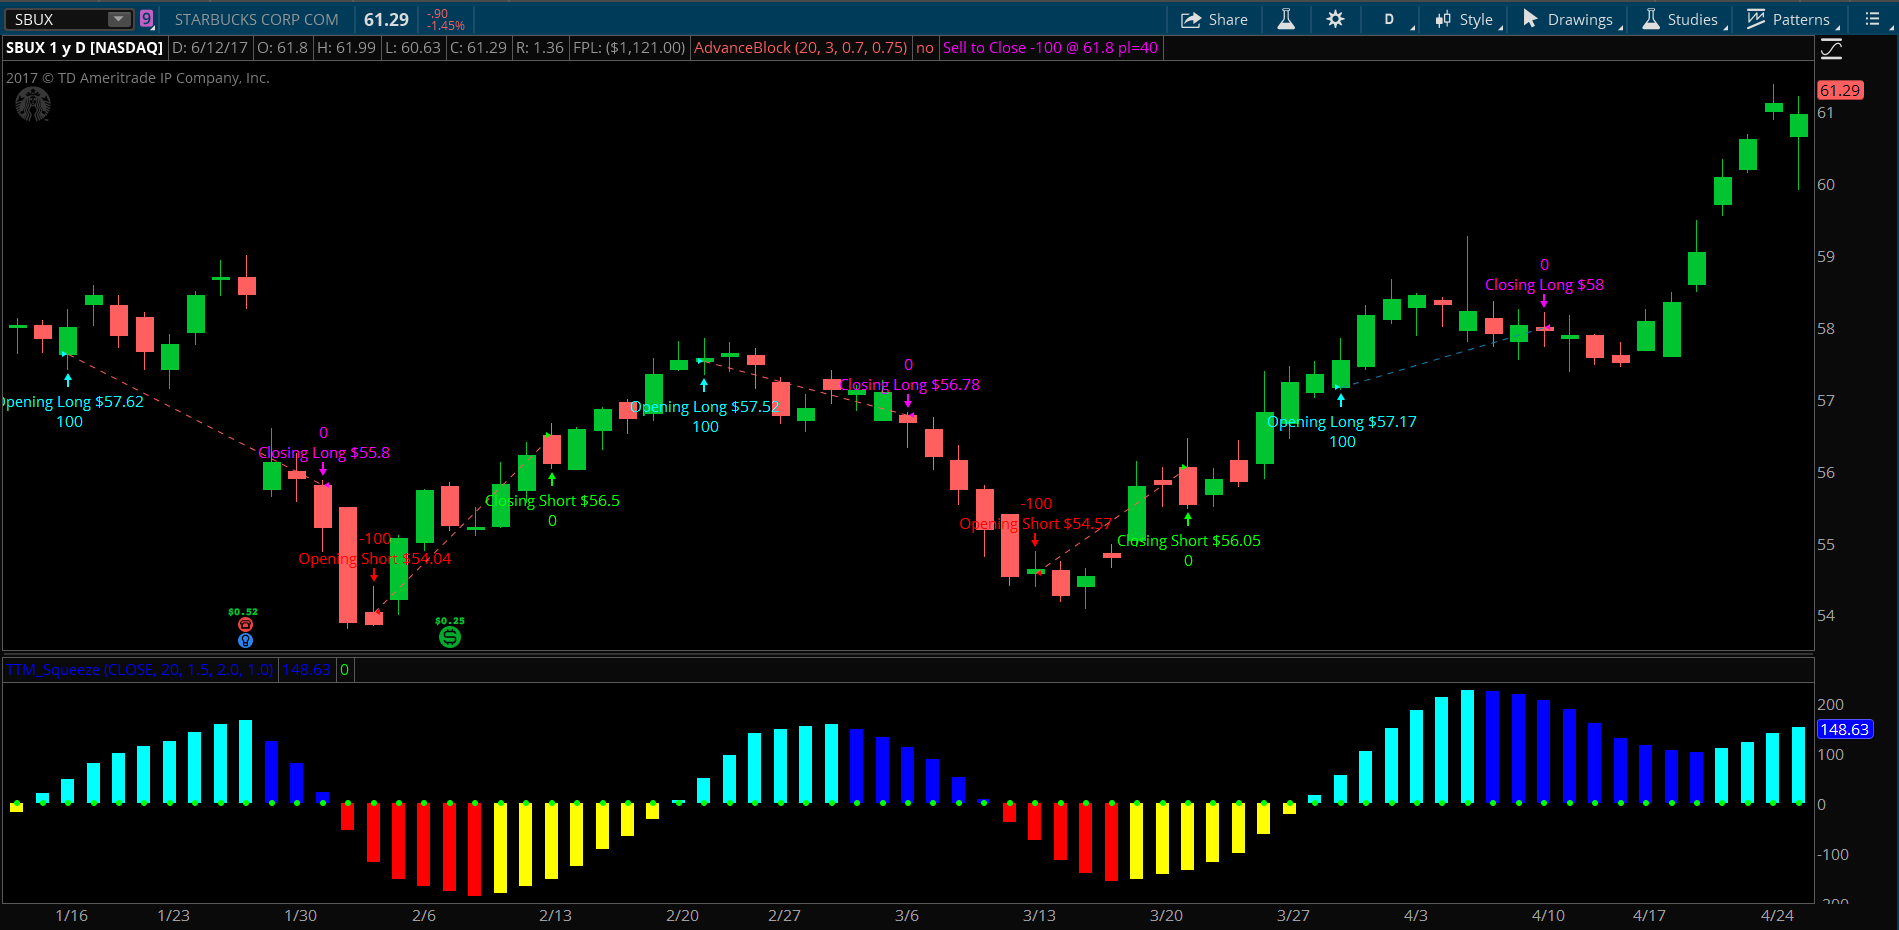
Ok, based on the clarification I will show the code required to build the strategy based solely on the histogram of the TTM Squeeze. Please note that the original request was to enter and exit on the close of the signal bars. This may be possible to do in live trading. But on a historical chart we must execute at the open of the bar that follows the signal bar. This is because we must be sure to wait until the close of the bar to ensure the signal was valid. And someone may take this code and run it on a live 5 min chart. If we tried to execute on the signal bar during a live intraday chart, you would get signals that repainted as signals appeared and vanished. Hope I explained this well enough. Drop me a not in the comments section if you have questions.

So the code is pretty simple (as far as Strategies go). Here is the code, followed by a screenshot showing the theoretical orders plotted on the chart.

input tradeSize = 100;
input price = CLOSE;
input length = 20;
input nK = 1.5;
input nBB = 2.0;
input alertLine = 1.0;
def hist = TTM_Squeeze(price, length, nK, nBB, alertLine).Histogram;
def crossesAbove = hist[1] < 0 and hist > 0;
def crossesBelow = hist[1] > 0 and hist < 0;
def secondBlueBar = hist[3] < hist[2] and hist[2] > hist[1] and hist[1] > hist;
def secondYellowBar = hist[3] > hist[2] and hist[2] < hist[1] and hist[1] < hist;
AddOrder(OrderType.BUY_TO_OPEN, crossesAbove, open[-1], tradeSize, Color.CYAN, Color.CYAN, "Opening Long $" + open[-1]);
AddOrder(OrderType.SELL_TO_CLOSE, secondBlueBar, open[-1], tradeSize, Color.MAGENTA, Color.MAGENTA, "Closing Long $" + open[-1]);
AddOrder(OrderType.SELL_TO_OPEN, crossesBelow, open[-1], tradeSize, Color.RED, Color.RED, "Opening Short $" + open[-1]);
AddOrder(OrderType.BUY_TO_CLOSE, secondYellowBar, open[-1], tradeSize, Color.GREEN, Color.GREEN, "Closing Short $" + open[-1]);

Attachments:
Marked as spam
Posted by (Questions: 37, Answers: 4079)
Answered on June 12, 2017 4:03 pm
0
Hey Pete, Thanks for writing this. I think it has an issue. It seems to open another long position when it closes a short. Does not open another short when closes a long tho. Could you take a look, i dont really want another position to open when one closes Thanks much ps…i added a screen shot. This symbol is AUS/USD (forex). have noticed it several places. Thanks
( at June 13, 2017 12:47 pm)
0

The way the code is constructed that should not be possible. I checked the screenshot I provided and did not see any examples of what you describe. Please provide a screenshot showing an example of this occurring.

( at June 13, 2017 12:58 pm)
0

i sent the screen shot. Let me know if you dont get it. The symbol is AUS/USD. the ones show are dated 4/19 and 3/16 but there are others. Thanks.

( at June 13, 2017 2:54 pm)
0

I did not receive a screenshot. But I did open a daily chart of AUD/USD. I tried using Bid/Mark/Last price types. Tried with and without the #. I found no such behavior on the dates you specified. Did you change any settings after loading the code into Thinkorswim?

( at June 13, 2017 3:27 pm)
0

I have tried and tried to upload the screen shot but it will not go, I am unable to type in the place below where it says to POST YOUR ANSWER.
I haven’t changed any settings but still getting the same results. IF you can send me your emai address I will
try to email the screen shot to you. Thanks!

( at June 14, 2017 9:52 am)
0

You can view my email address on my profile. I won’t post it here in the forum to avoid spam bots. Here is a link to my profile: https://www.hahn-tech.com/members/pete-hahn-2/

( at June 14, 2017 10:50 am)
0

Thanks Pete, i sent the screen shot. If it doesnt arrive let me know.

( at June 14, 2017 1:26 pm)