Study to PLOT a LINE connecting two or more matching candle lows


Category:
0
0

Hello – I’m trying to write a study that connects the lows between 2 or more candles with equivalent lows.  I wrote this:

plot PatternPlot5 = if (low[-1] == low or low[1] == low,low,DOUBLE.NAN);
PatternPlot5.SetPaintingStrategy(PaintingStrategy.LINE_vs_POINTS);
PatternPlot5.SetDefaultColor(color.red);

which works most of the time when two or more candles have equivalent low values, but it’s drawing some diagonal lines between two sets of equivalent candles, which I’m trying to avoid.  I’d like to use LINE and not DASHES as a painting strategy because my goal is to connect the low wicks/shadows, of matching low candles.

Do you have any suggestions, recommendations on how I might modify my script to get it to work correctly and not show the diagonal lines?


Attachments:
RESOLVED
Marked as spam
Posted by (Questions: 1, Answers: 5)
Asked on January 7, 2018 1:41 pm
1015 views
0
Private answer

Have you tried PaintingStrategy.HORIZONTAL?

Marked as spam
Posted by (Questions: 37, Answers: 4091)
Answered on January 7, 2018 6:25 pm
0

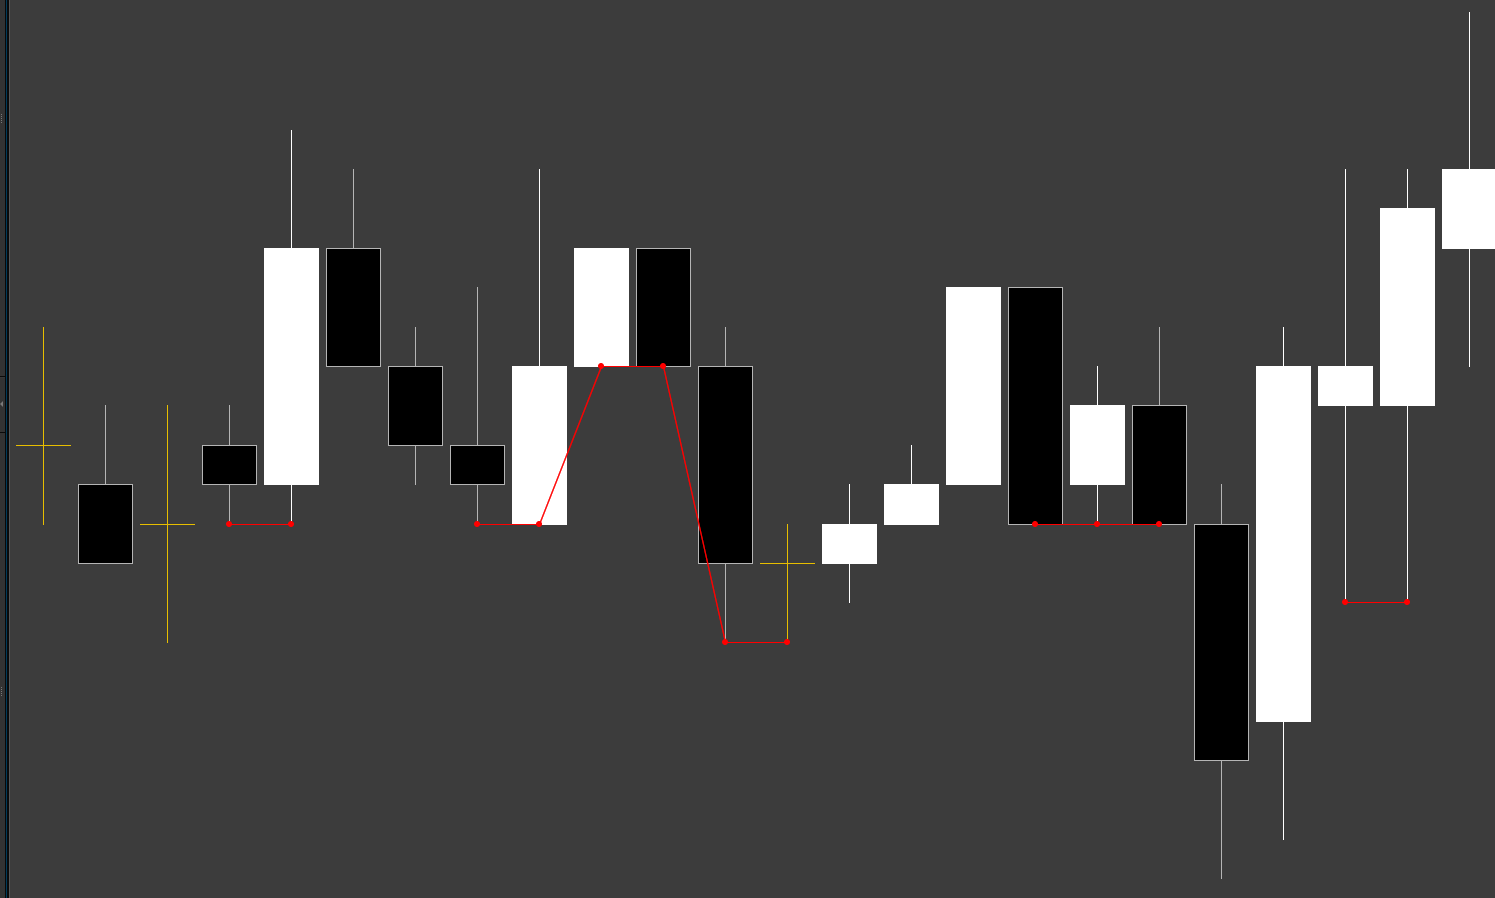
Hi Pete – Yes, I had considered that but found that the Horizontal line covered up dragonfly and gravestone dojis making the charts hard to read in those cases (more prevalent in small timeframes). Yes, I’m certain I could thicken one or the other, but visually not optimal. LINE_vs_POINTS does not obstruct the entire top or bottom line of a doji and clearly connects just the wicks, which is what I’m seeking. I haven’t figured out now to eliminate those diagonal lines.

( at January 8, 2018 2:48 pm)
0

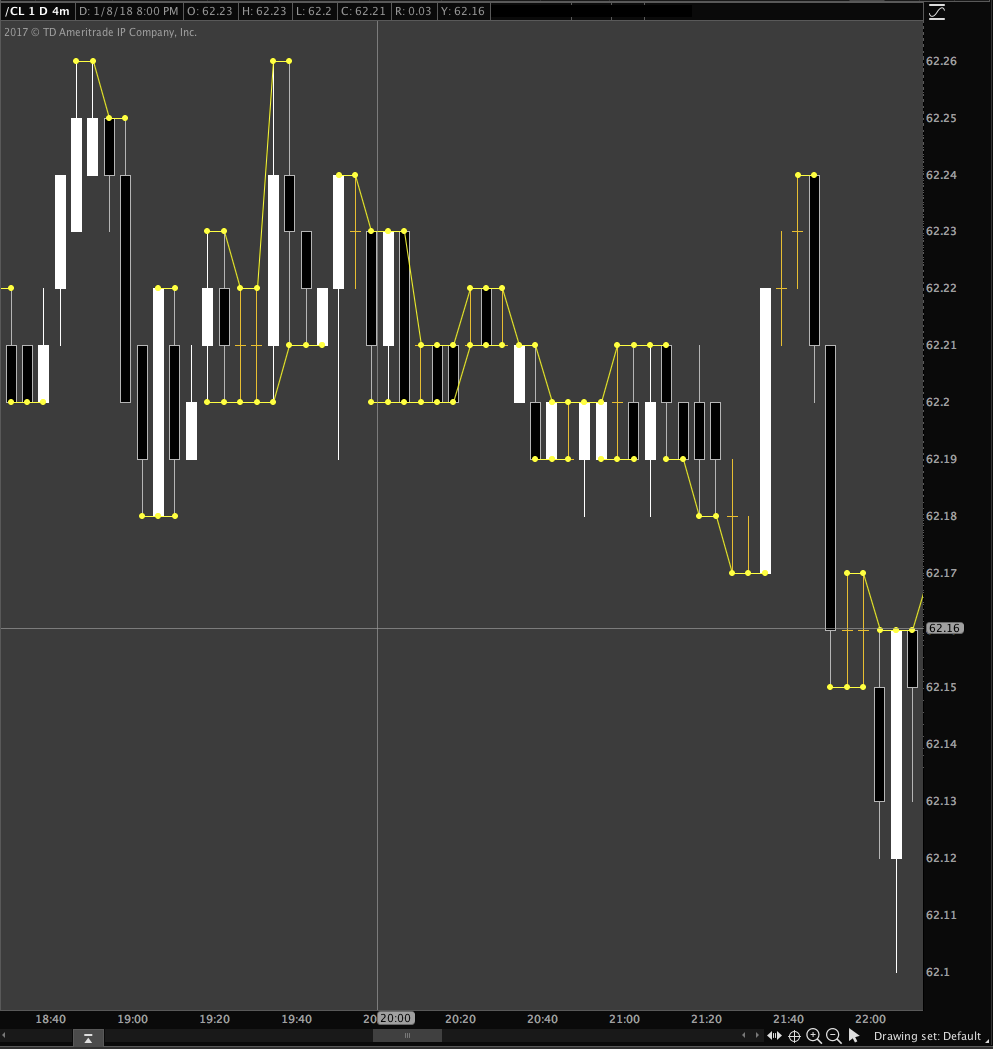
Your screenshot lacks the ticker symbol and time frame data. I would like to be able to bring up this exact chart on my platform to see if I can solve this. Don’t want to take the time to find a place with 3 of these patterns in a row.

( at January 8, 2018 4:08 pm)
0
Private answer

Had difficulty posting.  Had to do a ‘shift open’ on the link to get this answer in.  OK.. in response to your question:

Take a look at /CL (oil futures) in TOS and set the chart to 4 minute period.
You can visit yesterday Jan 08 2018 at 8:00pm PST.
 
Image *attached* with further detail.
 
Best,
Gregory

Attachments:
Marked as spam
Posted by (Questions: 1, Answers: 5)
Answered on January 9, 2018 3:27 pm
0
Private answer

Ok, thanks for taking the time to get me a full chart screenshot. Helps a great deal.

I had some ideas I wanted to try and this gave me a chance to focus on that rather than searching for price patterns and assuming I was finding patterns specific to your goals.

I was not able to find a solution. I can tell you why, so that you understand what you are up against. But at this time I cannot dream of a solution. That could change.

So when you use any style type that includes a line, the platform is designed to automatically connect consecutive candles that have a value other than Double.NaN. That’s just the way it is. If you set one of the candles to zero, you will get a diagonal line that drops all the way down to zero and back again if the next bar is anything other than Double.NaN. (you can avoid this by using Double.POSITIVE_INFINITY, but it does not address your particular issue) In order to prevent a diagonal line between two candles of unequal lows, one of them has to be set to Double.NaN (or Pos/Neg Infinity). Which breaks your indicator entirely.

The only idea that comes to mind is to create multiple plots. And configure each of them to pick up isolated multiples of equal lows. In the case where you have three consecutive sets, you would need to use three different plots. And clearly define each to ignore the other two. But then what happens when you have 4 sets in a row? or 5? This is an endless exercise.

In other platforms, the programing language gives us access to drawing objects. This could easily to achieved in Sierra Chart, or TradeStation. Because those platforms let us place drawing tools on the chart.

Sorry I don’t have a solution. But at least you have learned what you are up against.

Marked as spam
Posted by (Questions: 37, Answers: 4091)
Answered on January 9, 2018 5:00 pm
0
Private answer

Pete – fantastic answer.  I had noodled around this for some time and didn’t quite get where I was going wrong but this explanation makes sense.  Wish I could delete a plot between two candles; I thought of changing the color to match the background if possible;  and yes, 4 sets in a row or 5 – challenging too, but there are rare cases where studies need to be.  I may end up going that direction worse case, so that’s helpful.

TOS’ Thinkscript is excellent in many regards but missing in others at times.

Eventually, I will move the script over to TradeStation (EasyLanguage) so I will reduce priority on this for now and just visually understand what is being communicated when I see that.

Again – thank you sir!

Best,
Gregory

Marked as spam
Posted by (Questions: 1, Answers: 5)
Answered on January 10, 2018 3:05 pm
0

You are very welcome. Glad I could help. I do a lot of custom code in EasyLanguage so I can also be of service there. Keep that in mind.

( at January 10, 2018 4:51 pm)
0
Private answer

Making as resolved for now.

Marked as spam
Posted by (Questions: 1, Answers: 5)
Answered on January 10, 2018 3:06 pm