SVEPivot is between the Open and Close of the candle


Category:
0
0

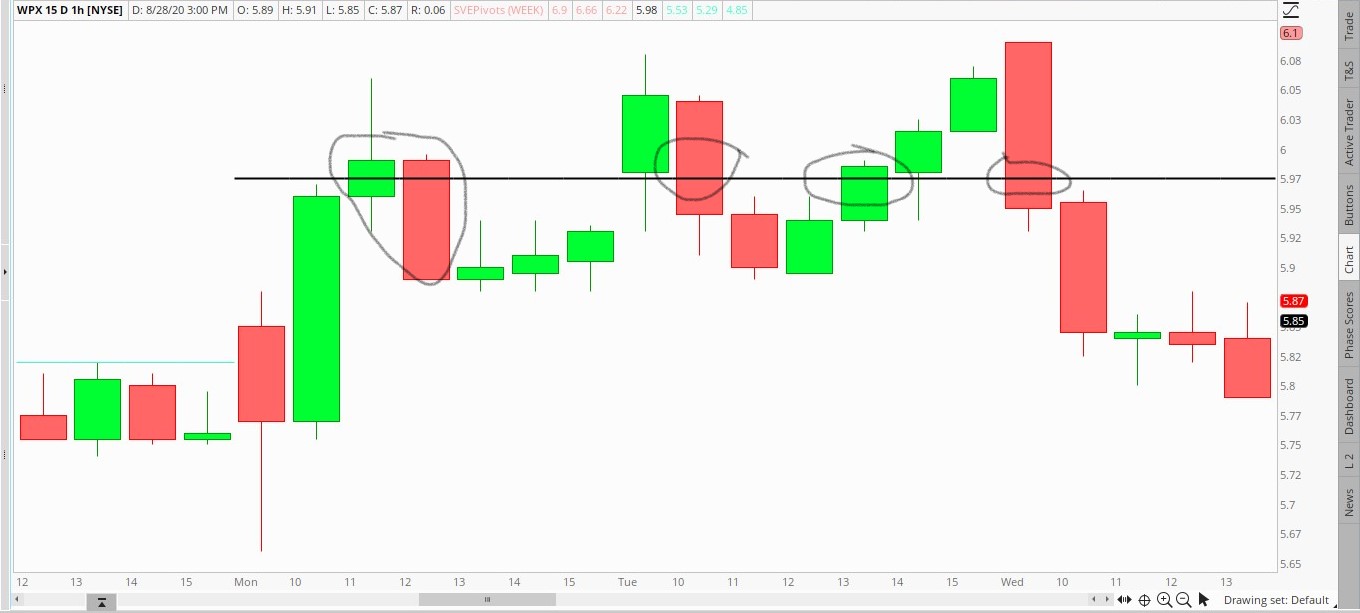
Hello there! I have learned so much from this site regarding ToS scanners and watchlist but I cannot seem to solve this problem after a YEAR of tweaking and finding solutions in the net. I hope to ask in this forum if ever you are free to answer.

To cut it short, I want to make a scanner that involves the 1 hr chart’s current candle is in between the weekly (SVEPivots) central pivot. I was having a problem with the conflicting aggregation period which results to an error.

input aggregationPeriod = AggregationPeriod.WEEK;
input aggregationPeriod1 = AggregationPeriod.HOUR;
def PH = high(period = aggregationPeriod)[1];
def PL = low(period = aggregationPeriod)[1];
def PC = close(period = aggregationPeriod)[1];
def centralpivot = (PH + PL + PC) / 3;
def pricebetweenpivot = centralpivot between open(period = aggregationPeriod1) and close(period = aggregationperiod1);
plot scan = pricebetweenpivot;

This is the code I am working on right now still error. I hope you can help me edit this one soon. Wish you the best!

Attachments:
Marked as spam
Posted by (Questions: 5, Answers: 6)
Asked on August 29, 2020 11:21 pm
232 views
0
Private answer

It is impossible for a candle to be "between" a single value. So rather than saying "...current candle is in between the weekly (SVEPivots) central pivot...." you should consider describing that in terms that can actually be achieved. From your screenshot it seems the way this should be described is "SVEPivot is between the Open and Close of the candle". So I have updated the title of your question to reflect that. But certainly they way you described it cannot ever exist in this universe. Consider this when searching for solutions and this may help you find better results.

Sorry but I have very bad news for you. Secondary aggregation periods are not supported within the code of a Study Filter of a scan on Thinkorswim. But you already new that.

If you want to run the scan on the 1 hour time frame you cannot reference a study that is computed from a higher time frame. The only way to work around this limitation is to write the code to capture and retain the High, Low and Close from the previous week. This requires the use of recursion, which is a very advanced technique. I only permit 15 min to provide each solution in the Q&A forum and constructing this scan would take far more time than I am allowed to spend.


Marked as spam
Posted by (Questions: 37, Answers: 4084)
Answered on August 30, 2020 10:56 am
0
Thank you for the correction, Hahn. It is central SVE Pivot in between open and close of current chart's candle. I was wondering if I can use HIghest and Lowest functions from Monday-Friday and the Friday close to obtain the values for central pivot (central pivot = (PH+PL+PC)/3) OR I can say that the close (since all timeframes/aggregation period of charts have the same closing or current price) is in between LL or HH of the pivot's aggregation period. If the latter is more feasible, I want it to have a tighter range but I don't know how to edit the formula. I hope to hear suggestions from you.
( at August 30, 2020 6:39 pm)
0
The only suggestion I have is to use recursive variables. There is no other solution to this problem. I really and truly do not have time to provide a complete solution to this request in the Q&A forum.
( at August 30, 2020 6:42 pm)
0
I understand. Thank you for your insight, Hahn. I will be posting a question not related to this topic in FAQs regarding how to study think scipt.
( at August 30, 2020 8:16 pm)