| ♥ 0 |
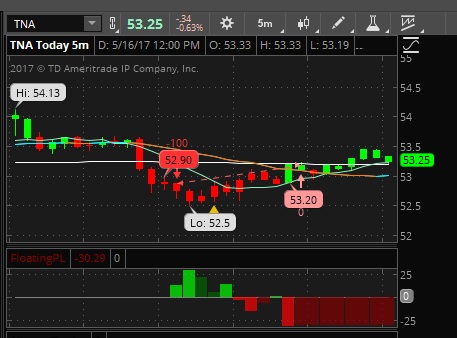
I’m using that feature “FloatingPL” on the thinkorswim platform, # plot FPL = FPL(); FPL.SetPaintingStrategy(PaintingStrategy.SQUARED_HISTOGRAM); And then I had this idea of plotting another histogram similar to the “FloatingPL” but based on some risk parameters, That will help in decision-making during the day I mean, it probably will not be anything too complicated because the calculation involved in the process is quite simple FPL = (current price) – (entry price) Anyways, just throwing this topic in the air, case anyone have knowledge in this area that could share with us and Thank you Pete for continuing to supply this community with plenty of thinkorswim information Attachments:
Marked as spam
Asked on May 16, 2017 9:05 am
4345 views
|
|
Private answer
As of the time of this post there is nothing in the Thinkscript language reference that makes this possible. The nearest element they give us is a function called EntryPrice(). Details here: http://toslc.thinkorswim.com/center/reference/thinkScript/Functions/Others/EntryPrice.html A quick test reveals that this function is only valid when used within a strategy and not within a study. Create a study with these two lines of code:
Even if there is a strategy present on the chart the output of this remains N/A for it’s entire span. So it cannot be used to create custom P/L graph. In order to do anything meaningful at all they would need correct for this. They meaning the Thinkorswim developers. They would also need to create several other functions to read other elements from the active strategy in the chart and enable it to be plotted in a lower subgraph. In this article I detailed some of these challenges: https://www.hahn-tech.com/thinkorswim-strategies-complex-stop-management/ The only other alternative is to abandon the entire concept of using a strategy to plot theoretical buy and sell orders. In it’s place you would write your own framework to mimic the work done by the strategy engine. It is only within this framework that you could control all the elements needed to keep track of each theoretical entry/exit/price/trade size. And from that, you could create whatever sort of P/L calculations you want. This is a BIG project. One that would cost a lot of money. Given there are other platforms out there that can already handle this I’m not sure it’s worth the expense. Marked as spam
Answered on May 16, 2017 9:55 am
|
|||||
|
Private answer
It’s not true that entry price cannot be used to customize your PnL; I spent an entire weekend actually creating my own, most of the time, if not all, was focused on figuring this out. The reason I wanted to make my own is because using PnL to determine which stocks preforms well with a certain strategy is almost in terms of dollar value.What matters is your total percentage returns on the strategy. For instance, if I made $5 or 50% on $10, and $5 on $1MM or essentially zero, the charts data would read the same. How to get around this: within your strategy, set you chart to price type Last, go to the last line of code and do something like: “plot FPL= (entryprice()-close)/close”. You can customize as you wish but that is the general idea. Marked as spam
Answered on May 22, 2017 3:53 pm
|
|||||
|
Private answer
Here is the answer I had, from the team of ThinkScript Unfortunately, the base code for FloatingPL is hard-coded into the platform and the code is not available. The FloatingPL study uses the FPL() function, which is what is hard-coded and not written in thinkScript. For more information about FPL, please see this link: http://toslc.thinkorswim.com/center/reference/thinkScript/Functions/Others/FPL.html Best Regards, Trade Desk/thinkScript Marked as spam
Answered on May 23, 2017 12:31 pm
|
Glad you got something working. I tried your suggestion but it did not plot anything for me. All I got was N/A. I think what you are actually getting is close/close. The EntryPrice() is being counted as a zero and the rest of the equation is being processed. Try doing the same with only EntryPrice() as your data element.
Awesome, this one works. Now what to do with it? You can’t get it off the chart into an Excel spreadsheet. Which is where something like this can actually be used for analysis. Why not just export the Strategy report to Excel and perform all your analysis there? Not picking, just curious.