| ♥ 0 |
One of our viewers submitted this as a project request:
Marked as spam
Asked on June 10, 2019 8:21 am
3338 views
|
|
Private answer
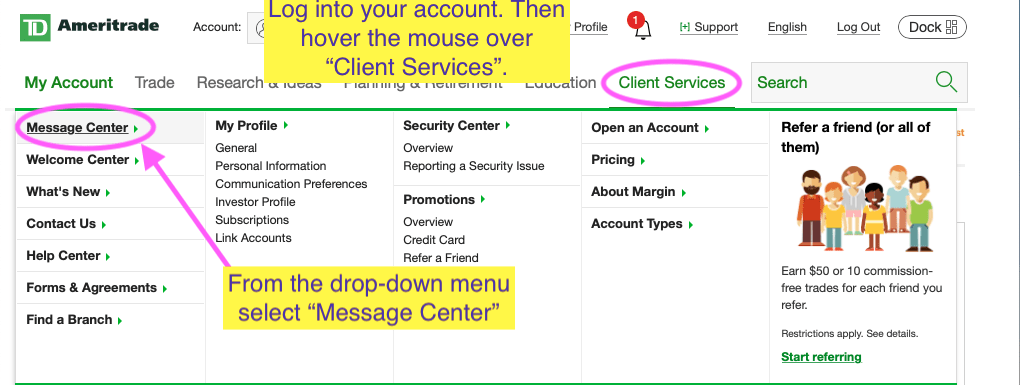
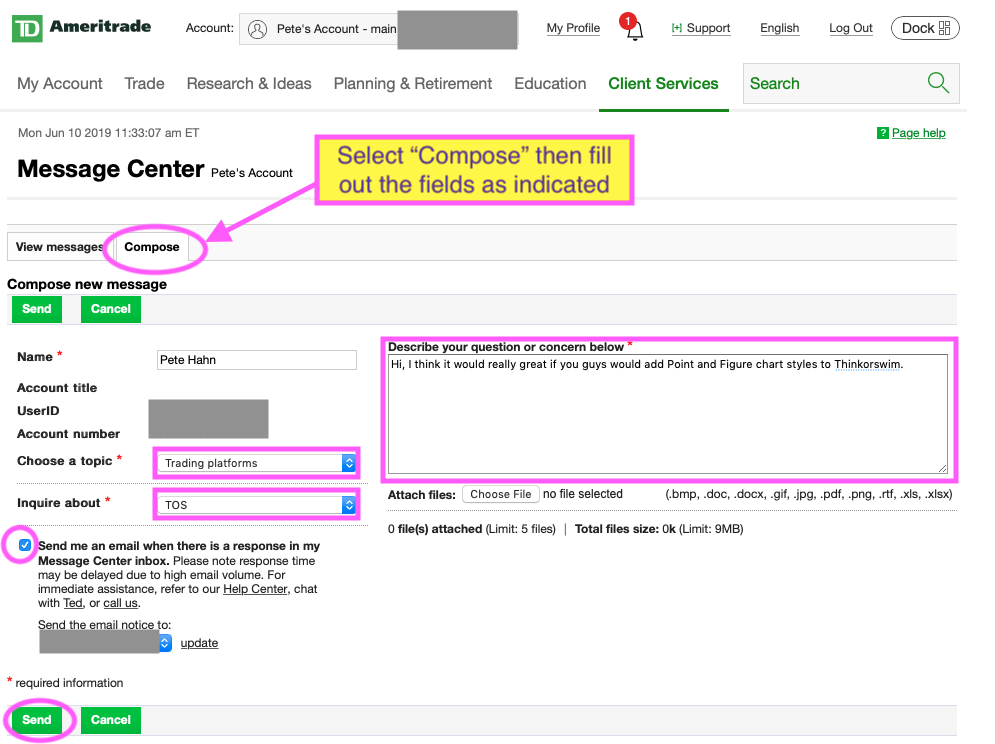
Hi Rick, Thanks for taking the time to submit your project request. For most trading platforms the Point & Figure charts are built into the platform and they are considered a chart style. Not an indicator or chart study. It is not possible to create a Point and Figure (P&F) chart from the thinkscript used to write custom chart studies on the Thinkorswim trading platform. In order for P&F chart to be added to Thinkorswim this will have to be written into the platform by their developers. Which means the only way to get P&F charts added to the platform is if a large number of users submit this to TDA support as a feature request. How do I do this? Go to https://www.tdameritrade.com/home.page Then log into your account and follow the instructions on the screenshots below. Attachments:
Marked as spam
Answered on June 10, 2019 8:43 am
|