| ♥ 0 |
Hello, I have a piece of code that repeats a lot and would like to make it into a subroutine but it doesn’t have a plot statement in it. Is there a way to do this? Here is the code # Program to display label of EMA crossovers of 2 given parameters for short and long periods input shortPeriod = 5; def timeFrame = GetAggregationPeriod(); if timeFrame == AggregationPeriod.MIN { if timeFrame == AggregationPeriod.THREE_MIN {
Marked as spam
Asked on June 3, 2018 8:26 pm
589 views
|
|
Private answer
Subroutine, sounds like a term used in Visual Basic for Applications. Other programming languages refer to them as Functions, or Methods. Closest thing we have in Thinkscript is something the call a script: http://toslc.thinkorswim.com/center/reference/thinkScript/Reserved-Words/script.html However, in the past I have found that there is a bug preventing these from working correctly when trying to apply secondary aggregation periods. I submitted a request to Thinkorswim support asking the to correct. But never bothered to follow up to see if they ever did. Marked as spam
Answered on June 3, 2018 9:35 pm
|
|
|
Private answer
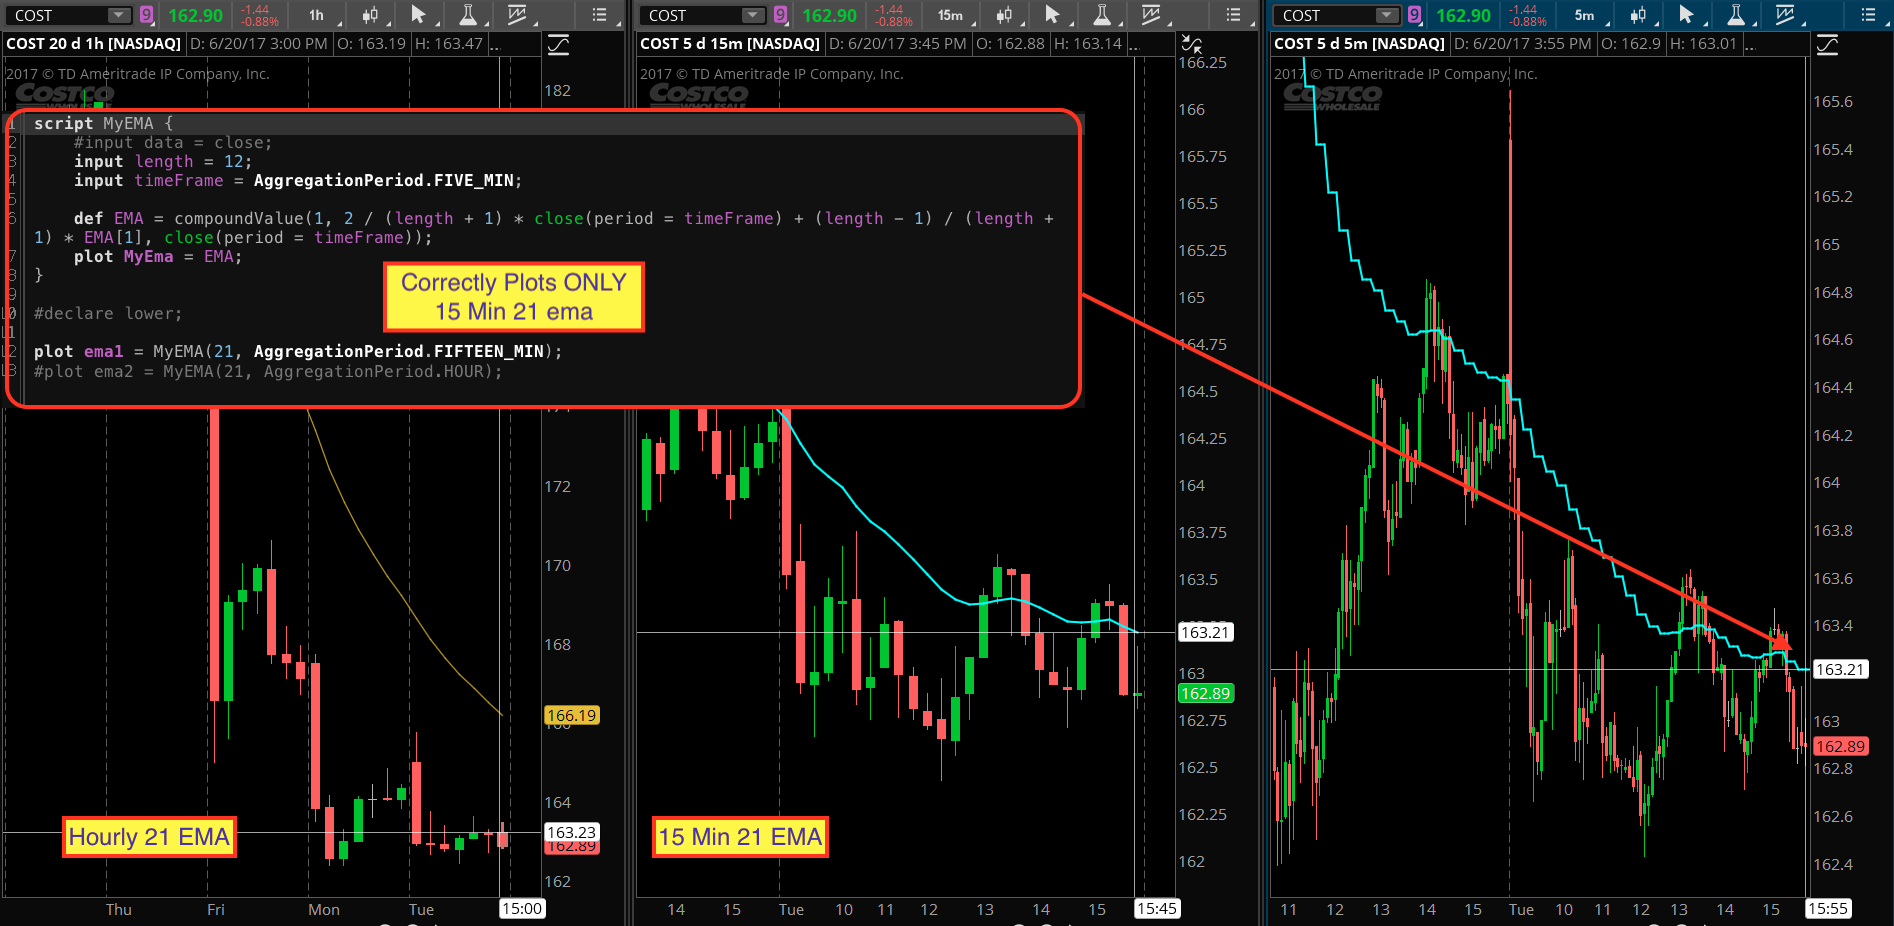
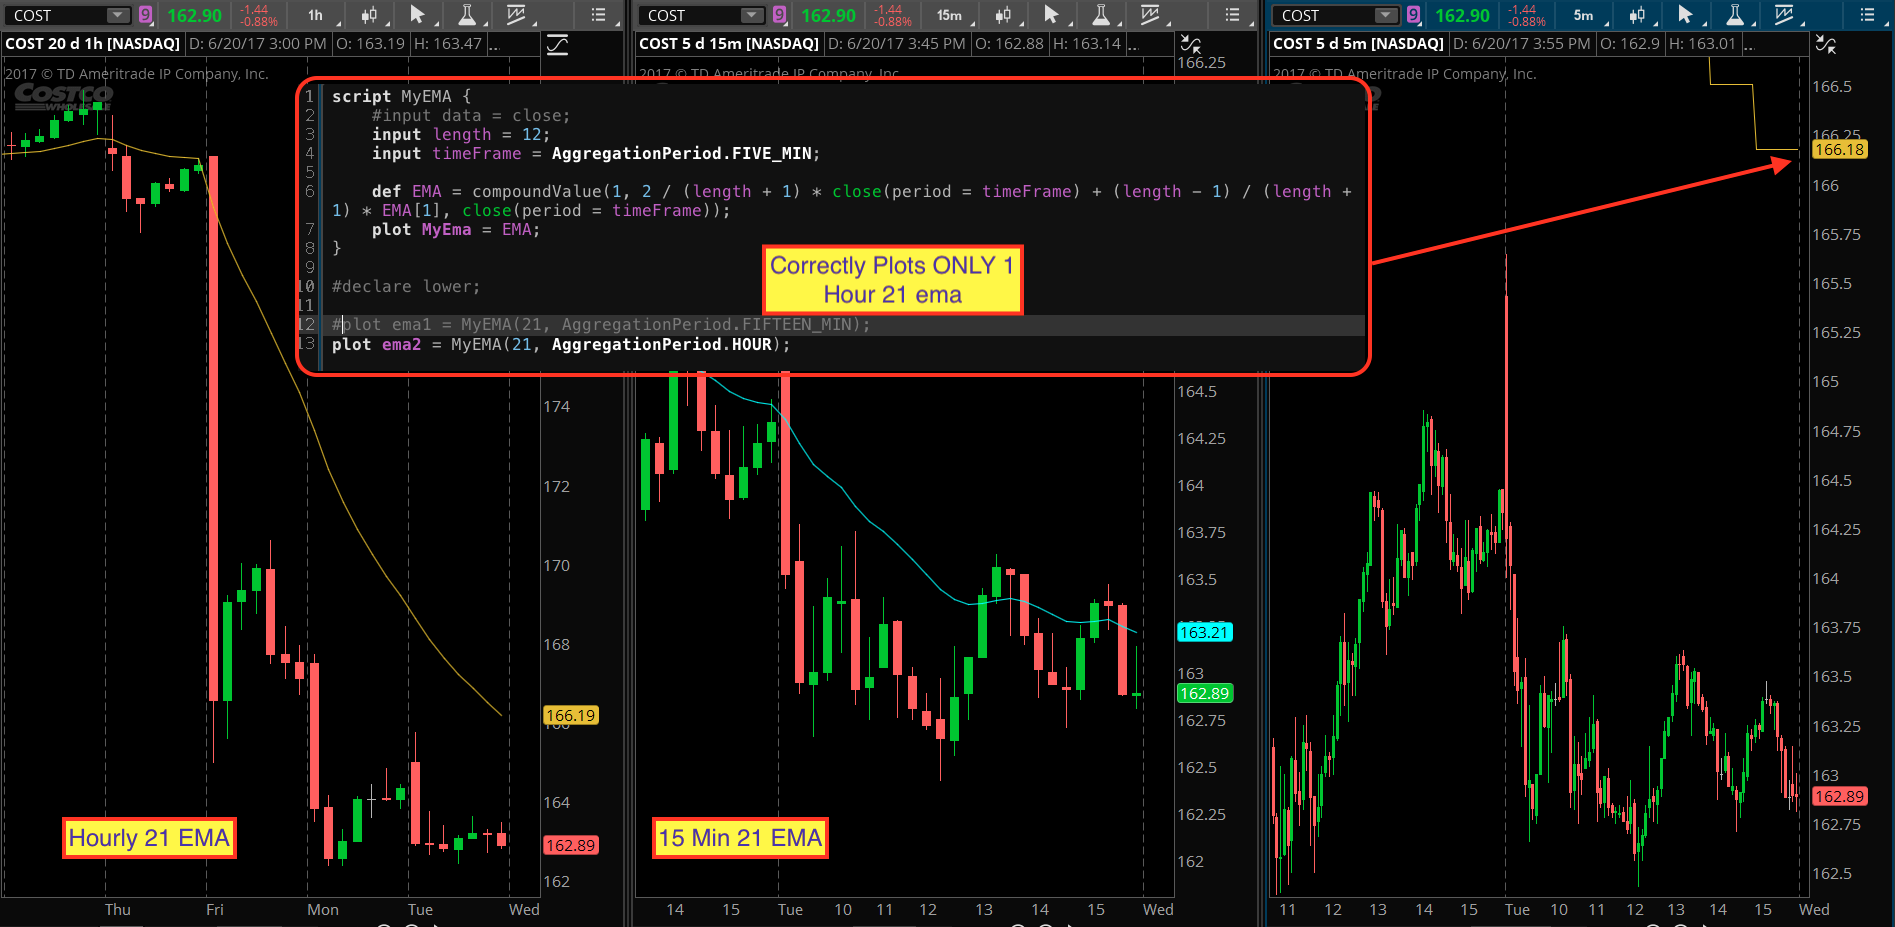
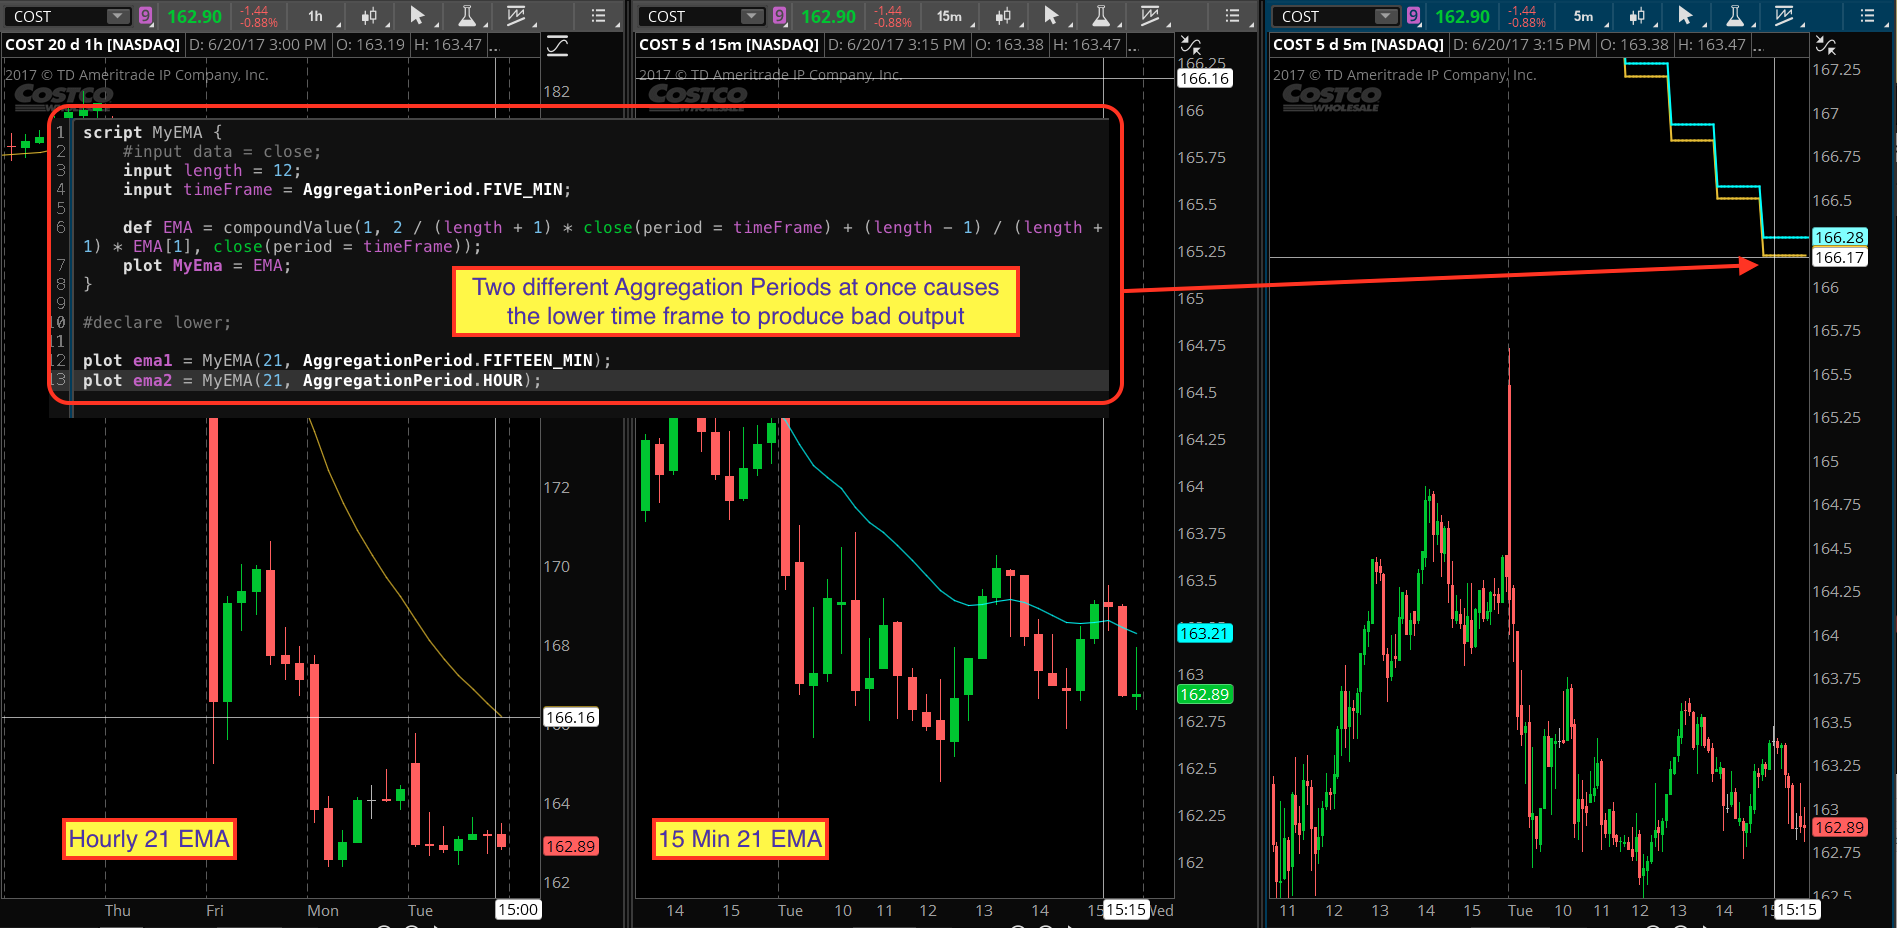
Recall in my original answer I mentioned there was a bug preventing the use of more than one secondary aggregation period on the same script. I decided to go find the email where I submitted this bug report to Thinkscript support. Then I put together the original code I submitted to them so I could see if the bug had been fixed. It is not. Still broken. Here I am providing the code and screenshots I originally submitted to Thinkscript support. This should save you a ton of wasted time trying to figure out why it won’t work.
Attachments:
Marked as spam
Answered on June 4, 2018 9:18 am
|
Thanks for replying. I was trying to use script {} but that required that there were a Plot statement in it. I have not been able to find a way to create a function/method without this Plot statement ?
Ah, ok. Well there is no way to create a script without a plot statement. So you don’t need to keep trying to find a way around that. If it helps, the plot statement of a script does NOT display anything on the chart. It happens to be the return value of the script. It’s actually a function. Functions have return values. Data in and data out. The Plot statement of the script is how to get data out.