| ♥ 0 |
Is there a way on Sierra to calculate the distance (Price) from the trailing ema without having to do it manually? How far is the top of the current bar in relationship to the ema if price is going up and if price is going down the price relationship from the low of the bar to the ema.
Marked as spam
Asked on June 4, 2018 6:28 pm
696 views
|
|
Private answer
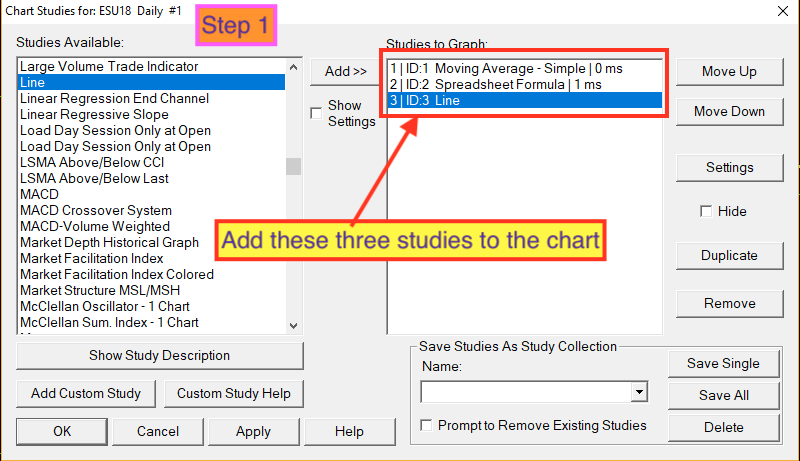
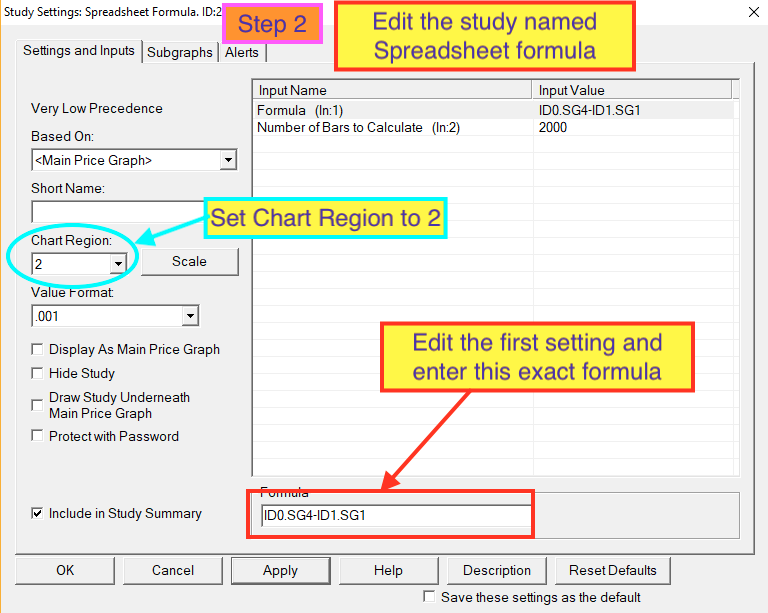
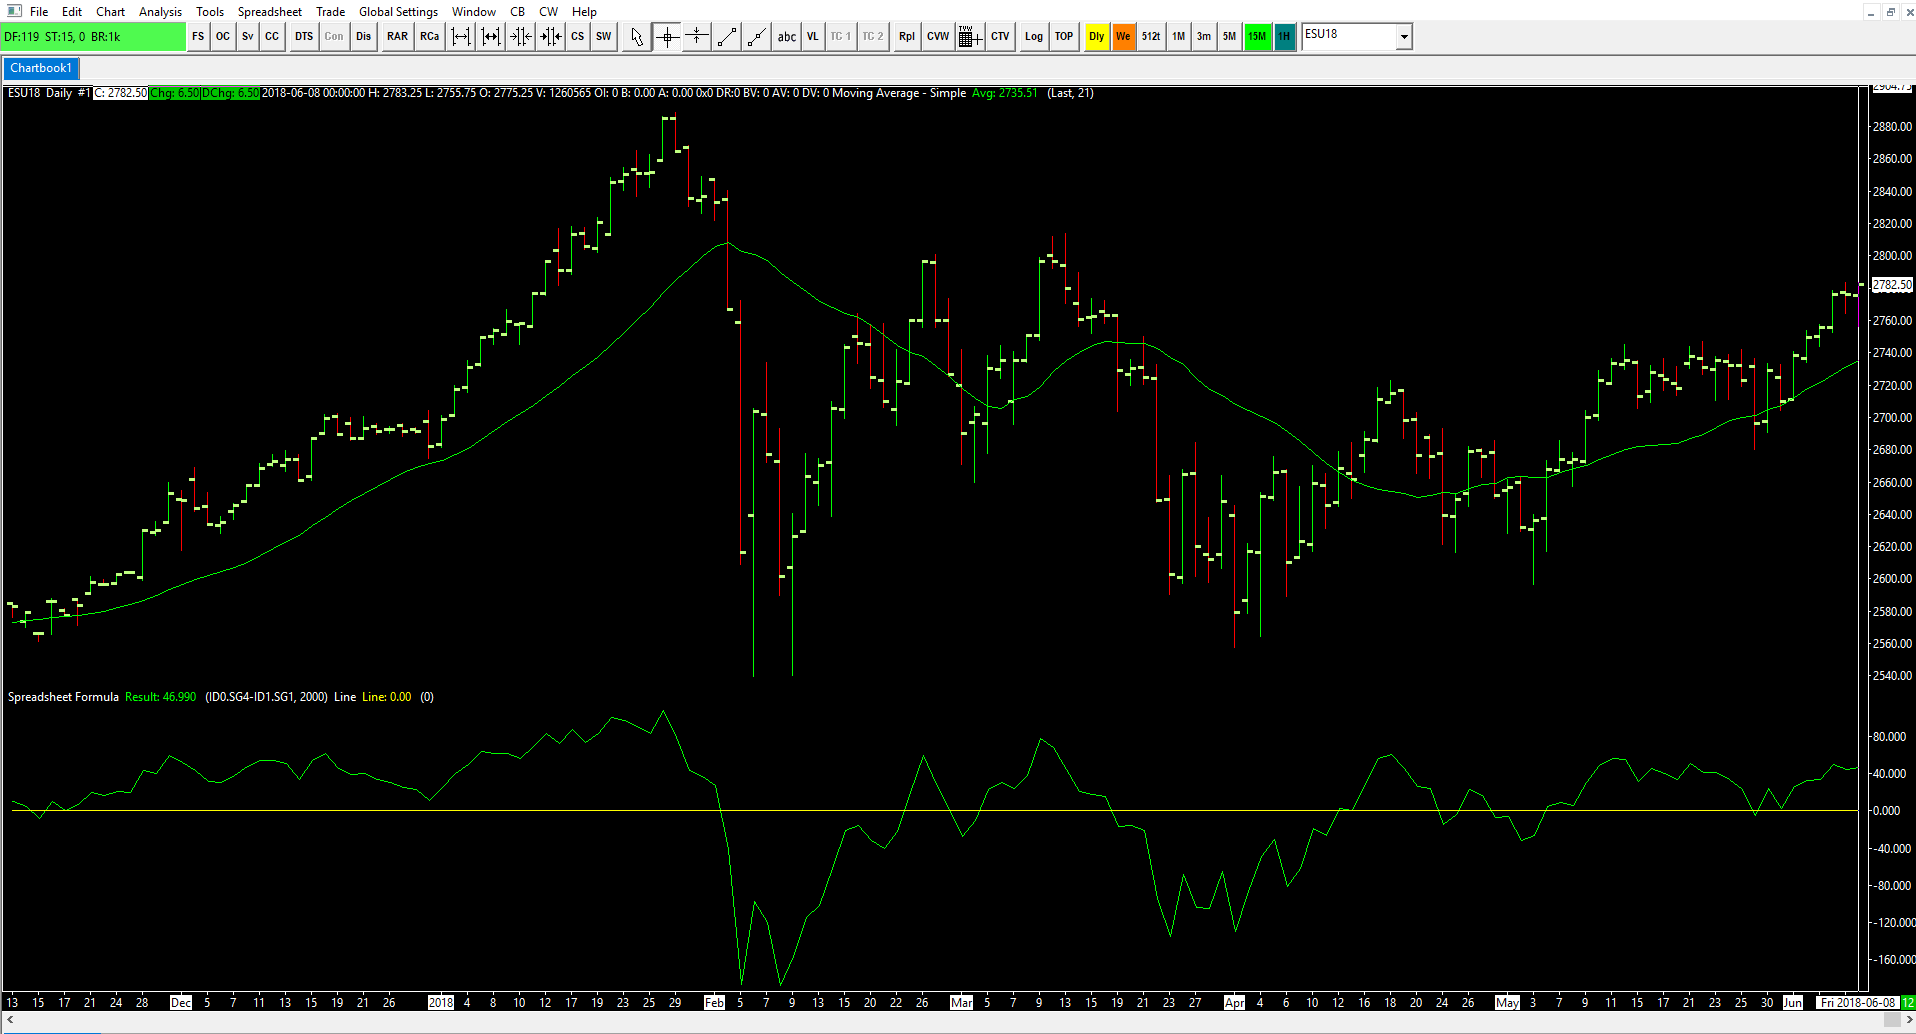
Ok, thanks for the clarifications Wayne. The solution is presented here in the following three screenshots. As I have explained in a previous post, exactly how the plots of the chart as well as other studies are referenced using formulas. The chart data O, H ,L , C, V is referenced using the base element of When you add a new study to the chart, it gets assigned a unique ID# based on the order in which it was added to the chart. In my example the first study I added was a simple moving average. To reference the value of this study we use the following: Once you get the hang of this it will really open up a lot of doors. We use the study named “Spreadsheet Formula” to contain and plot the formula that subtracts the value of each bar’s close from the value of each bar’s simple moving average:
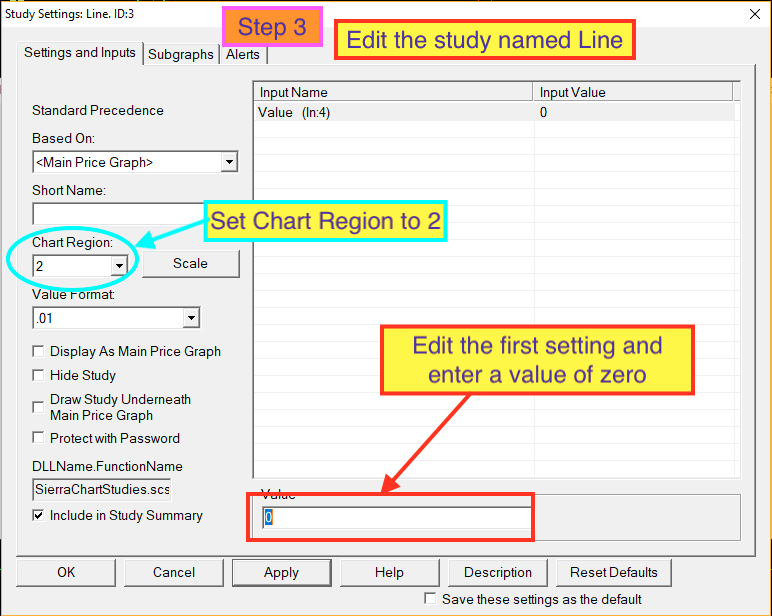
I added the study named “Line” to act as the zero line, since the output of the formula oscillates across the zero line. If you know anything about the MACD study, you could have very easily accomplished the same thing just by changing the settings. Anyone that wants to take a shot at this, be sure to post your solution as a new answer to this topic. You may want to express this value as a percent, to make this scaleable across a wide variety of instruments. The following formula will plot the percentage difference between close and simple moving average:
Attachments:
Marked as spam
Answered on June 10, 2018 11:26 am
|
You want to plot this in a lower subgraph? How to measure “if price it going up” and “if price is going down”? You see that? When you say, how far is the high below the ema, This automatically declares that prices are going down, not up. So you have a bit of a contradiction here until you explain things further. Why did you neglect to provide a screenshot with your quest??? This could have explained all the details missing from your very brief specification.
Reminder, still waiting for Wayne Popham to provide additional details as requested.
I got the idea for the question from PAT’s trading on Youtube. They use only trend lines and a 21 ema. the Question was intended to assume that the market that one is looking out was in a trend if up higher highs and lower lows and a down trend lower lows and lower highs. We all know that markets are never trending at all times.and the markets consolidate or chop whatever one might want to call it. In an up trend the further the top of the price gets from the 21 ema, when it does this the market is closer to a retractment
Or in a down trend the lower the price the further it get from the 21 ema. I don’t care if the distance is shown on the main price graph or lower in an indicator section.