Three Moving Average Scan


Category:
0
0

I have the following scan set up that’s not giving me any results at this time but I would like Pete or someone to make sure I do have this set-up properly. Here’s the rules:

  1. Find a stock price that crosses above the 10 day EMA
  2. The stock price must be above the 200 SMA
  3. The stock price must be below the 50 SMA (50 SMA must above the stock price)

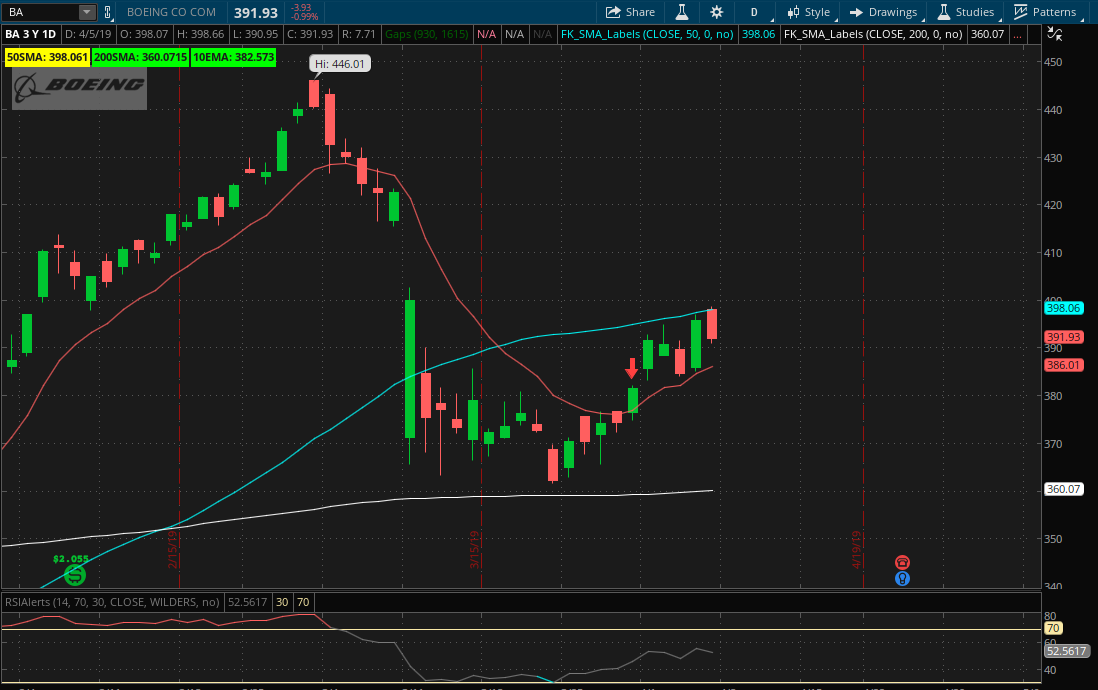
I have a sample photo of BA where this came into play (see the red arrow indicating the stock crossed above the 10 EMA(red), above the 200 SMA (white) but still below the 50 SMA (blue).

Thanks for the help.

Here’s the code:

input price = close;
input length1 = 10;
input length2 = 50;
input length3 = 200;
input barsAfterCross = 2;

def EMA1 = expAverage(price, length1);
def SMA1 = SimpleMovingAvg(price, length2);
def SMA2 = SimpleMovingAvg(price, length3);
def crossAbove = EMA1[1] < SMA1[1] and EMA1 > SMA1;
def crossBelow = EMA1[1] > SMA1[1] and EMA1 < SMA1;

#use this to scan for bullish burst
plot scan = crossAbove[barsAfterCross – 1] and EMA1 > price and price > SMA2 and price < SMA1;


Attachments:
Marked as spam
Posted by (Questions: 21, Answers: 47)
Asked on April 7, 2019 9:41 pm
593 views
0
Private answer

This may not be the total solution. But the first thing that jumps out at me is that you have some errors in your plot scan statement:

plot scan = crossAbove[barsAfterCross – 1] and EMA1 > price and price > SMA2 and price < SMA1;

What you have there is “EMA1 crosses above SMA1 AND EMA1 is greater than price and SMA2 is less than price”. So you are saying that the 10 period ema is above the price while the 50 period sma is below the price. That is backwards from what you have specified in your request. And it leaves out the 200 sma. Another error is how you have defined the cross above. In your request you have stated: “Find a stock price that crosses above the 10 day EMA”. Yet for this portion are actually checking when two moving averages cross.

So let’s correct the cross above first:

def crossAbove = price[1] < EMA1[1] and price > EMA1;

Next, we’ll correct your plot scan statement:

plot scan = crossAbove[barsAfterCross – 1] and price > SMA2 and price < SMA1;

I think this should do it. Test it out and let us know.

Marked as spam
Posted by (Questions: 37, Answers: 4079)
Answered on April 16, 2019 12:46 pm
0

Thank you for your help once again! Now to change this to a bearish scan!

( at April 16, 2019 8:46 pm)