| ♥ 0 |
Hi Pete, I have a question i hope you could help me out I am trying to see and develop a way to see which sector is in favor, and which industry is in favor , and them which stocks within that industry are in favor? Any thoughts would be great appreciated, Thank you for all your help you provided so far
Marked as spam
Asked on December 9, 2016 10:07 pm
1061 views
|
|
Private answer
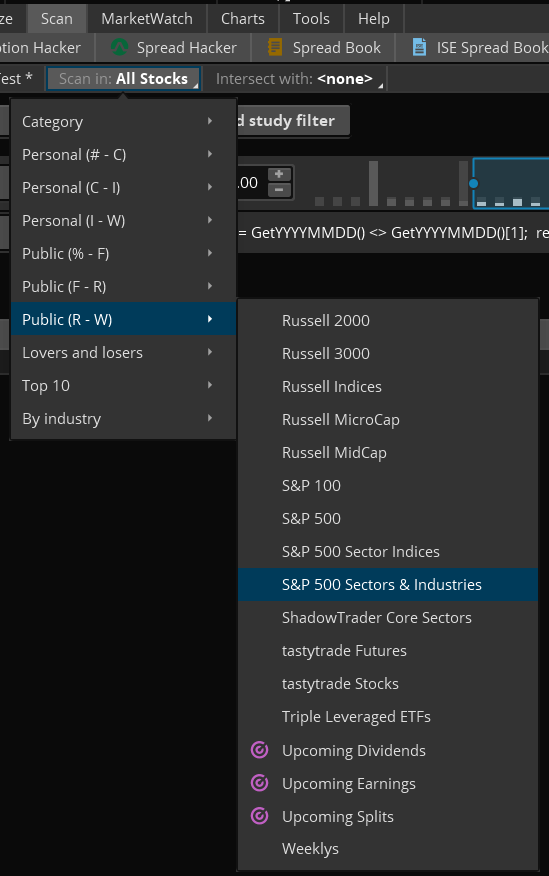
Ok, so a top down approach would start at an index such as the S&P or NASDAQ. You asked how to tell which industries/sectors are ‘in favor’. The best method I am aware of would be to use a comparison like Relative Strength. By comparing each industry or sector against a major index you can see which ones are gaining and which are loosing against the majority of the market. The U.S. market has been reacting very strongly to recent election results. It would be helpful if the Relative Strength indicator could be set with a “starting point” of November 9th, 2016. We have published just such a tool and you can view the video and get the free code at this link: Thinkorswim Scan Relative Strength Once you identify particular industries/sectors of interest you could then use the ticker symbol of the industry/sector as the comparison and scan the list of individual stocks within that industry/sector to find which ones are leading the charge. The scan engine in Thinkorswim contains several built in lists of indices for industries and sectors. Of particular note they provide “S&P 500 Sector Indices” and “S&P 500 Sector & Industries”. Screenshot provided for reference. Volume information in Thinkorswim does not contain “buying and selling” activities such as how many shares traded at the bid versus the ask. So we don’t have a very effective tool in Thinkorswim to include volume in our analysis. Attachments:
Marked as spam
Answered on December 10, 2016 9:53 am
|
|
|
Private answer
Since this data is not available from within the ThinkScript language it means we don’t have access to it from indicators, charts or watch lists. You mention a table, and for that we have Time and Sales. But you can’t really do much with that other than tape-reading. I’ve seen one of the trading outfits demonstrate “unusual options volume”. Although I don’t have a clue how they read that on Thinkorswim. You might take a look at this and see if it is something you can use: http://toslc.thinkorswim.com/center/howToTos/thinkManual/charts/Chart-Modes/Chart-Types/equivolume.html Marked as spam
Answered on December 12, 2016 1:54 pm
|
|
|
Private answer
Thank you Pete,
As far as the bd vs ask volume, is there anything out there that you have seen on how to measure it ?
Marked as spam
Answered on December 10, 2016 11:17 am
|
|
|
Private answer
Hi Pete ,
Another questions in regards to volume,
Does TOS have anything to show the “Size of the order”? indicator?, Chart ?or just a table? …. etc.
Marked as spam
Answered on December 12, 2016 12:36 pm
|
I know that TradeStation and NinjaTrader are two platforms that make this data available within their language. I imagine there are many different ways to slice this and you’ll probably find many custom or built-in indicators for either platform. I personally am very skeptical of attempts to read to much into volume. Between the Algo’s, the HFT’s, and the Dark Pools…. the truth is likely impossible to attain. That’s just my option though.
Be sure to up-vote the answer that provided the best solution to your question!